
Figure 1.
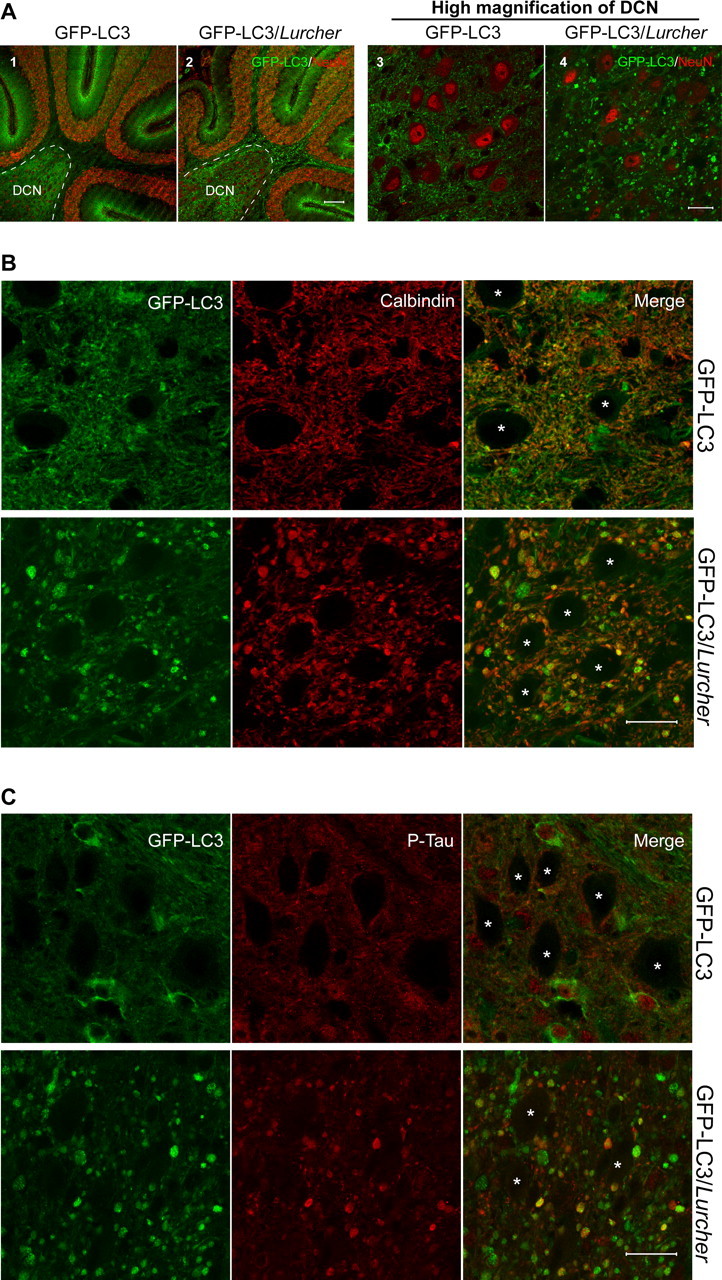
Accumulation of GFP–LC3 in the swollen axons of Purkinje cells in the DCN of GFP–LC3/Lurcher mice. A, Representative confocal images show the redistribution of GFP–LC3 to green foci in the DCN (enclosed area) of GFP–LC3/Lurcher mice (A2, A4). GFP–LC3 transgenic mice were used as control (A1, A3). Immunostaining with monoclonal anti-NeuN antibody (1:200) is shown in red. Scale bars: A1, A2, 100 μm; A3, A4, 20 μm. B, Overlapping of GFP–LC3 green fluorescence with red immunofluorescent staining of monoclonal anti-calbindin antibody (1:1000) in the DCN of GFP–LC3/Lurcher mice. Scale bar, 20 μm. C, Colocalization of GFP–LC3 (green) and phospho-Tau (red; stained with monoclonal anti-phospho-Tau antibody AT-8, 1:250) in the swollen Purkinje cell axons in the DCN of GFP–LC3/Lurcher mice. Scale bar, 20 μm. In both B and C, asterisks represent cerebellar nuclei.