
Figure 3.
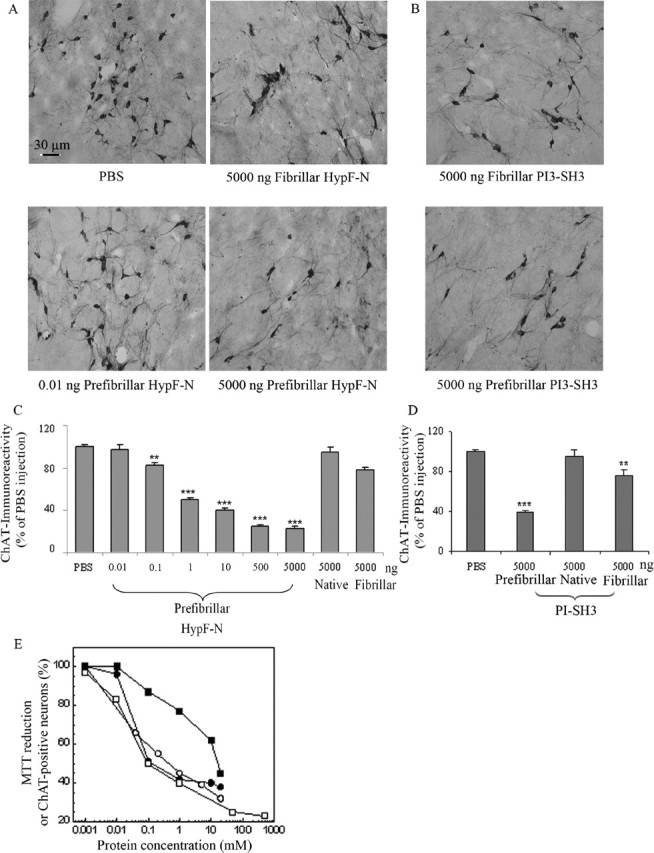
Disappearance of ChAT-positive neurons in the NBM injected with HypF-N or PI3SH3. Cholinergic neurons were visualized by immunohistochemistry as specified in Materials and Methods. A, Representative photomicrographs (20× magnification) obtained after injection of 1.0 μl aliquots of PBS, 5.0 μg of HypF-N fibrillar aggregates, and 0.010 ng and 5.0 μg of HypF-N prefibrillar aggregates (top left to bottom right, respectively). ChAT immunoreactivity was localized in intensely labeled NBM neurons located at the border between the internal capsule and the globus pallidus. B, The same as in A but taken after microinjection of 5.0 μg of fibrillar and 5.0 μg of prefibrillar PI3SH3. C, D, Quantification of ChAT immunoreactivity in the NBM 7 d after the injections (5 sections per animal). Rats were injected with PBS, 5.0 μg of native HypF-N, 5.0 μg of fibrillar HypF-N, varying quantities of prefibrillar HypF-N, 5.0 μg of native PI3SH3, 5.0 μg of fibrillar PI3SH3, or 5.0 μg of prefibrillar PI3SH3 (n = 6 for each type of injection). The total neuronal count in the NBM injected with PBS (190 ± 1.5, mean ± SD) was taken as 100%. C, The number of ChAT-positive cells in the NBM injected with 1.0 μl of PBS containing 5.0 μg (500 μm), 0.50 μg (50 μm), 10.0 ng (1.00 μm), 1.0 ng (100 nm), 0.100 ng (10.0 nm), and 0.010 ng (1.0 nm) of prefibrillar HypF-N was reduced by 77% (p < 0.001), 75% (p < 0.001), 60% (p < 0.001), 50% (p < 0.001), 17% (p < 0.01), and 3% (p < 0.05), respectively, relative to the number of ChAT-positive neurons found in the NBM of the contralateral hemisphere injected with PBS. (Molar concentrations are those of the monomeric HypF-N.) D, The number of ChAT-positive cells in the NBM injected with 5.0 μg of native, fibrillar, or prefibrillar PI3SH3 was reduced by ∼5% (p > 0.05), 20% (p < 0.01), and 60% (p < 0.001), respectively, with respect to the number of positive neurons found in the NBM of the contralateral hemisphere injected with PBS. (Molar concentrations are those of the monomeric PI3SH3.) Statistical analysis on the mean was performed by one-way ANOVA, followed by the Newman–Keuls multiple comparison test (F = 53.03; p < 0.05). ∗∗p < 0.01 and ∗∗∗p < 0.001 versus PBS. For details, see Materials and Methods. Scale bar, 30 μm. E, The same data as in C plotted as the concentration of injected HypF-N prefibrillar aggregates against the percentage of ChAT-immunopositive neurons (open squares). The percentages of viable cultured cells (as determined by the MTT test) exposed to differing concentrations of prefibrillar HypF-N (open circles) domain (Bucciantini et al., 2002), Aβ40 (filled squares), or Aβ42 (filled circles) peptides (Fezoui et al., 2000) are also reported.