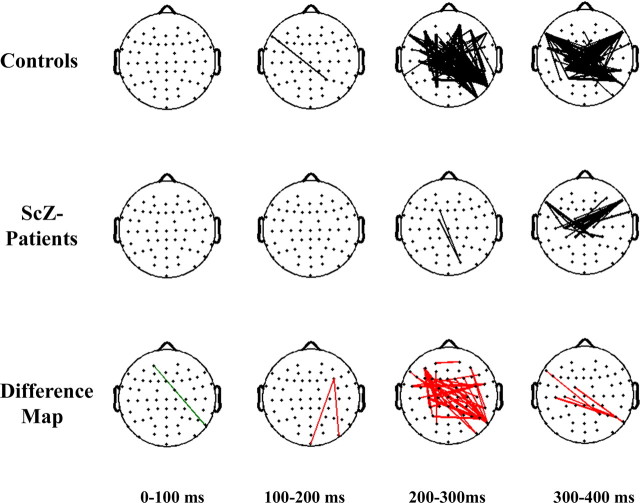
Figure 4.
Topography of phase synchrony for face condition. Top row, Controls. Middle row, Patients with schizophrenia. Bottom row, Difference map. Synchrony between electrodes is indicated by lines, which are drawn only if the synchrony value is beyond a two-tailed probability of p < 0.0005. Differences between groups are displayed in the bottom row. Red lines indicate a decrease in synchrony for patients with schizophrenia compared with controls. Green lines indicate an increase in synchrony for patients with schizophrenia relative to controls.

