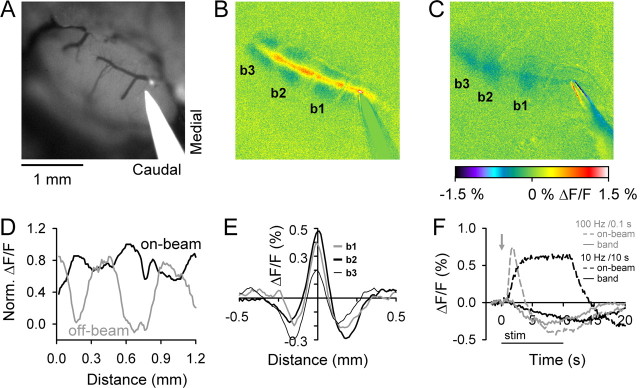
Figure 1.
Surface stimulation in Crus II evokes on-beam increases and off-beam decreases in fluorescence. A, B, Background fluorescence image of Crus II and pseudocolored image of the response to surface stimulation show the on-beam increases in fluorescence and off-beam parasagittal bands of decreased fluorescence. The three more lateral bands are labeled as b1–b3 in the pseudocolored image in B. Surface stimulation parameters were 200 μA, 100 μs pulses at 10 Hz for 10 s (100 pulses total). C, Response to surface stimulation in another animal using 100 μA, 100 μs pulses at 100 Hz for 0.1 s (10 pulses total). The images in B and C are taken from the time period in which the off-beam response is close to maximal (see F). D, Normalized intensity profiles measured along the long axis of the folium of on-beam (black) and off-beam (gray) regions show the alternating pattern of relative increase and decrease for the image in B. The off-beam response was converted to positive values, and both profiles were normalized with the maximum of each set to 1. E, Intensity profiles of the fluorescence changes perpendicular to the beam and aligned with the three parasagittal bands. F, Time courses of the on-beam (dashed lines) and off-beam (solid lines) responses obtained using the two sets of stimulation parameters in B (black traces) and C (gray traces). The horizontal bar below x-axis denotes the 10 s surface stimulation period and the gray arrow the time of the 0.1 s stimulation. The scale bar is 1 mm in this and all subsequent figures.

