
Figure 11.
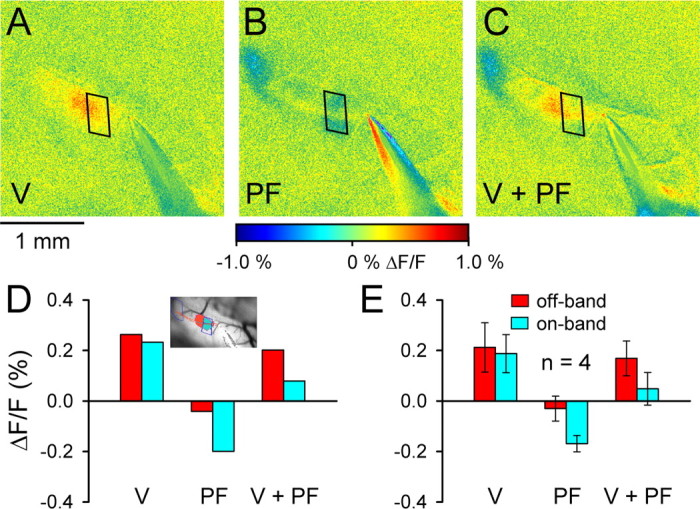
Parasagittal bands evoked by PF stimulation reduce and shape the response evoked by peripheral stimulation. A, Patch of increased fluorescence evoked by stimulation of the ipsilateral vibrissa (V). B, Parasagittal bands evoked by low-amplitude PF stimulation (50 μA, 100 μs pulses at 10 Hz for 10 s). C, Responses to combined stimulation of the PFs and vibrissa (V + PF). The trapezoids in A–C show the region of one of the PF-evoked parasagittal bands in B overlapping the patch evoked by vibrissa stimulation in A. D, ΔF/F for the regions of interest shown in the inset for the vibrissa, PF, and combined stimulation in A–C. The ROI in red in the inset is the region activated by vibrissa stimulation that did not overlap with the inhibitory band resulting from PF stimulation. The ROI in blue is the region activated by vibrissa stimulation that overlapped the inhibitory region activated by PF stimulation. E, Mean ± SD ΔF/F for similar ROIs and stimulation conditions for four animals. Color coding of the ROIs is the same as in D.