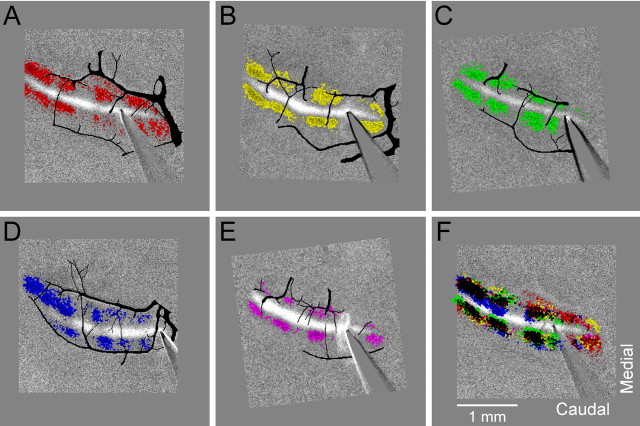
Figure 3.
Positions of the parasagittal bands in Crus II are similar across mice. A–E, Optical responses from five mice in which the on-beam increase in fluorescence is shown in grayscale. The off-beam decreases in fluorescence were thresholded, and, for each animal, the regions exceeding the threshold were pseudocolored using a different color. Each image was translated and rotated to achieve approximate alignment of the responses. The surface vessels were traced from the raw fluorescence images of the folia and overlaid in black on the grayscale images. F, Responses from A–E were superimposed to compare the positions of the off-beam parasagittal bands.

