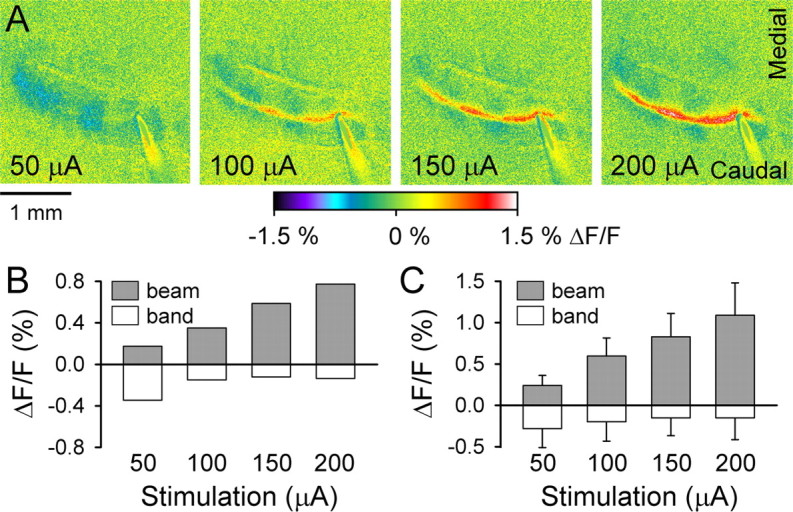
Figure 7.

Parasagittal bands are evoked at low surface stimulation amplitudes. A, Optical responses to surface stimulation at amplitudes indicated. Other stimulation parameters were maintained constant (100 μs pulses at 10 Hz for 10 s). B, Average ΔF/F for the on-beam (gray) increases in fluorescence and off-beam bands (white) of decreased fluorescence for the example in A. C, Mean ± SD ΔF/F for the beam and band regions from three mice.
