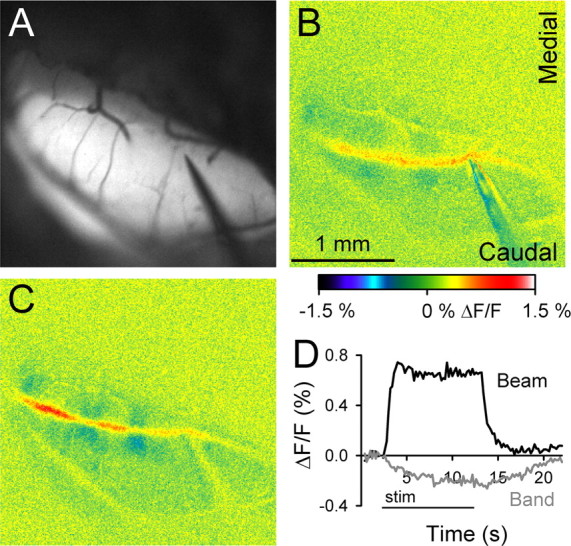
Figure 8.

Ca2+ imaging reveals the same banding pattern as autofluorescence imaging. A, B, Background autofluorescence image of Crus II and pseudocolored response to surface stimulation (50 μA, 100 μs pulses at 10 Hz for 10 s). C, Response to surface stimulation (40 μA, 100 μs pulses at 10 Hz for 10 s) after staining the folium with Oregon Green 488. D, Time course of the on- and off-beam responses using Ca2+ imaging.
