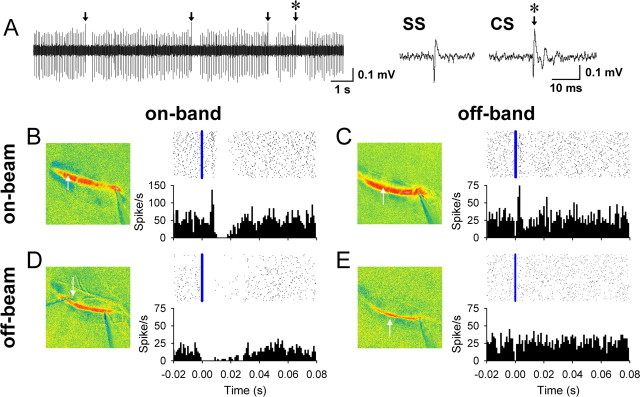
Figure 9.
Purkinje cell firing patterns in relation to beam and bands. A, Spontaneous simple spike (SS) and complex spike firing (CS, arrows) of a PC. The complex spike indicated by an asterisk is shown at a higher temporal resolution on the right. B–E, Raster plots and histograms of the simple spike firing of PCs located at four locations: on-beam and on-band (B), on-beam and off-band (C), off-beam and on-band (D), and off-beam and off-band (E). Histograms are constructed from four trials of surface stimulation at 200 μA, 100 μs at 10 Hz for 10 s.

