
Figure 3.
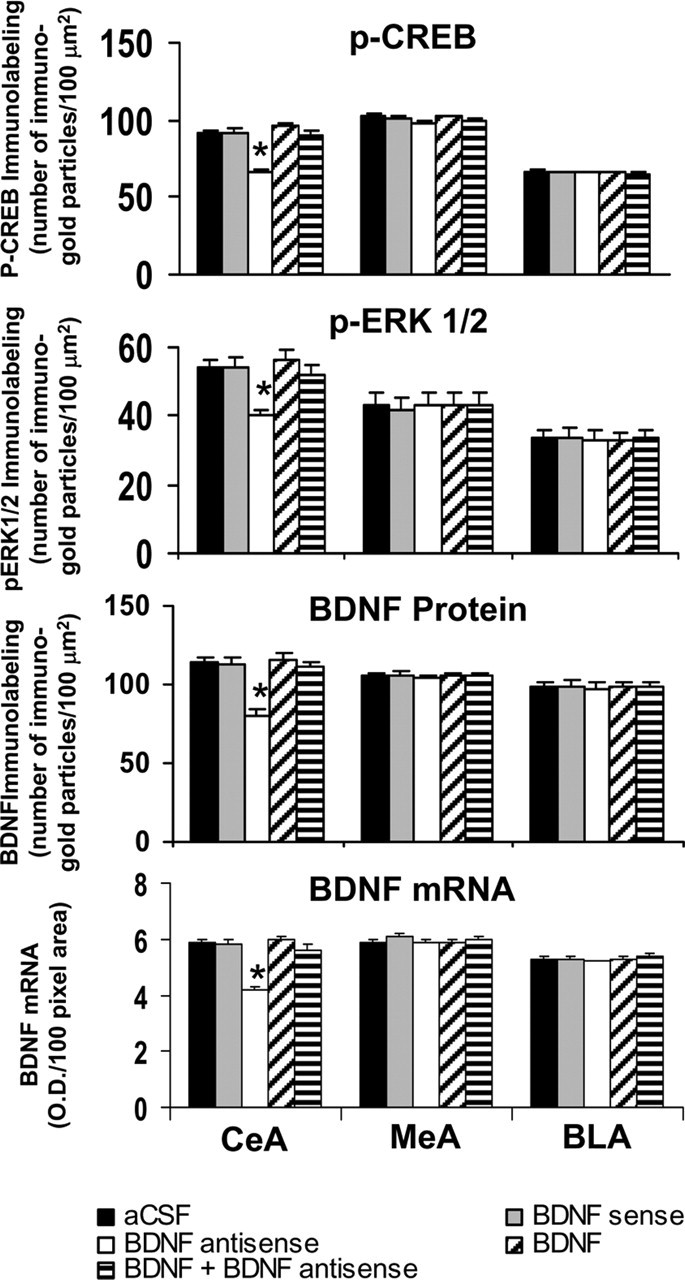
Quantitation of BDNF, p-CREB, and p-ERK1/2 protein levels (number of immunogold particles per 100 μm2 area) and mRNA levels of BDNF in the amygdaloid structures of rats infused with aCSF, BDNF sense, and antisense ODNs (with and without BDNF coinfusion) into the CeA. Values are the mean ± SEM of five to seven rats in each group. The asterisks indicate significant (p < 0.001) difference from aCSF-infused rats.