Figure 10.

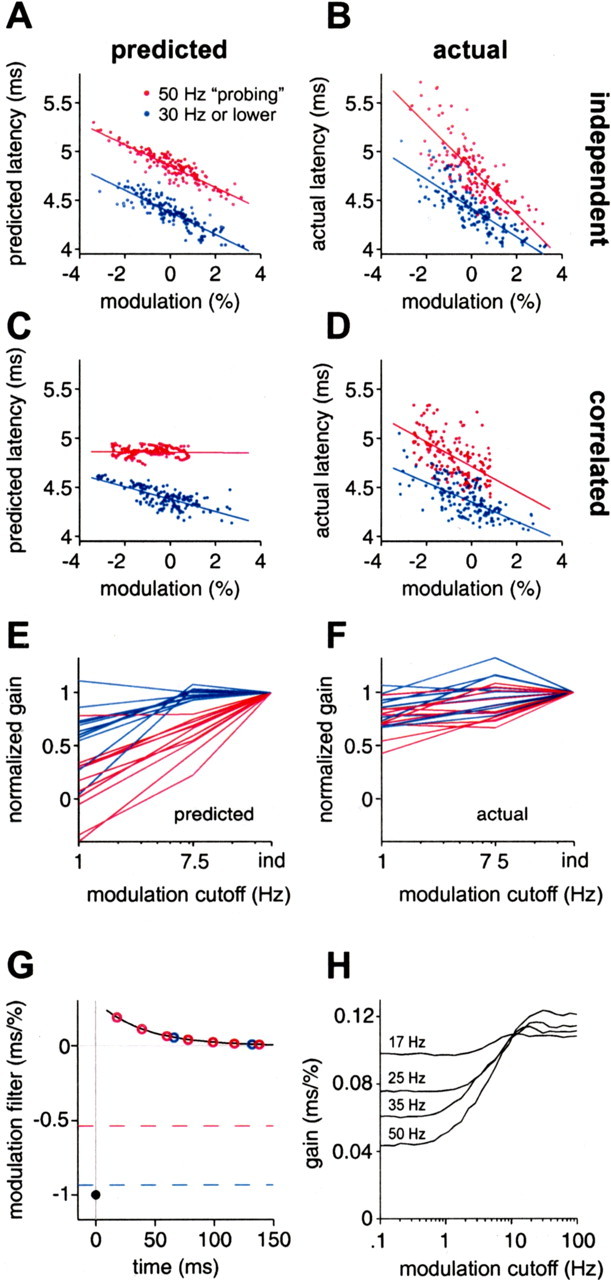
Discrepancies between actual and predicted latency for natural intervals and correlated amplitudes suggest a relationship between sensing rate, frequency of amplitude modulation, and afferent gain. A, B, Predicted (A) and actual (B) latency versus modulation amplitude, for natural intervals and independent amplitudes, with points colored by instantaneous rate. Actual latency has greater amplitude gain (magnitude of slope) at higher rates (red), whereas predicted latency has roughly constant gain. C, D, Same as A and B, but for correlated amplitudes. Actual latency (D) shows roughly constant amplitude gain at different rates, whereas predicted latency (C) shows markedly lower gain at high rates. E, F, Normalized gain versus cutoff frequency of correlated amplitude modulations (1 Hz, 7.5 Hz) at low EOD rate (blue) or high EOD rate (red), for predicted latency (E) and actual latency (F), in 11 afferents. Gains are normalized by gain for independent (ind) modulations in the same afferent. For plotting purposes, ind is placed at 30 Hz, just above the Nyquist frequency for EOD intervals used. G, Schematic explanation for the loss of gain in predicted latency in C. If the correlation time of amplitude modulations is much greater than the filter width, then modulation amplitude is roughly constant over the filter window. Present and past modulation amplitudes then make opposing contributions to latency. The summed effects of past and present modulations at low rate (blue circles) lead to a small loss of gain, but, at high rate (red circles), the loss may be substantial. Values for the respective gains are indicated by dashed lines. H, Calculated gain versus low-pass cutoff frequency of correlated amplitude modulations, for constant rates of 17 (mean rate for white-noise protocol), 25, 35, and 50 Hz, using the white-noise modulation filter for the afferent shown in A–D. Longer correlation times (lower cutoff frequencies) lead to a loss of gain at all rates, but the loss is greater at higher rates.
