
Figure 11.
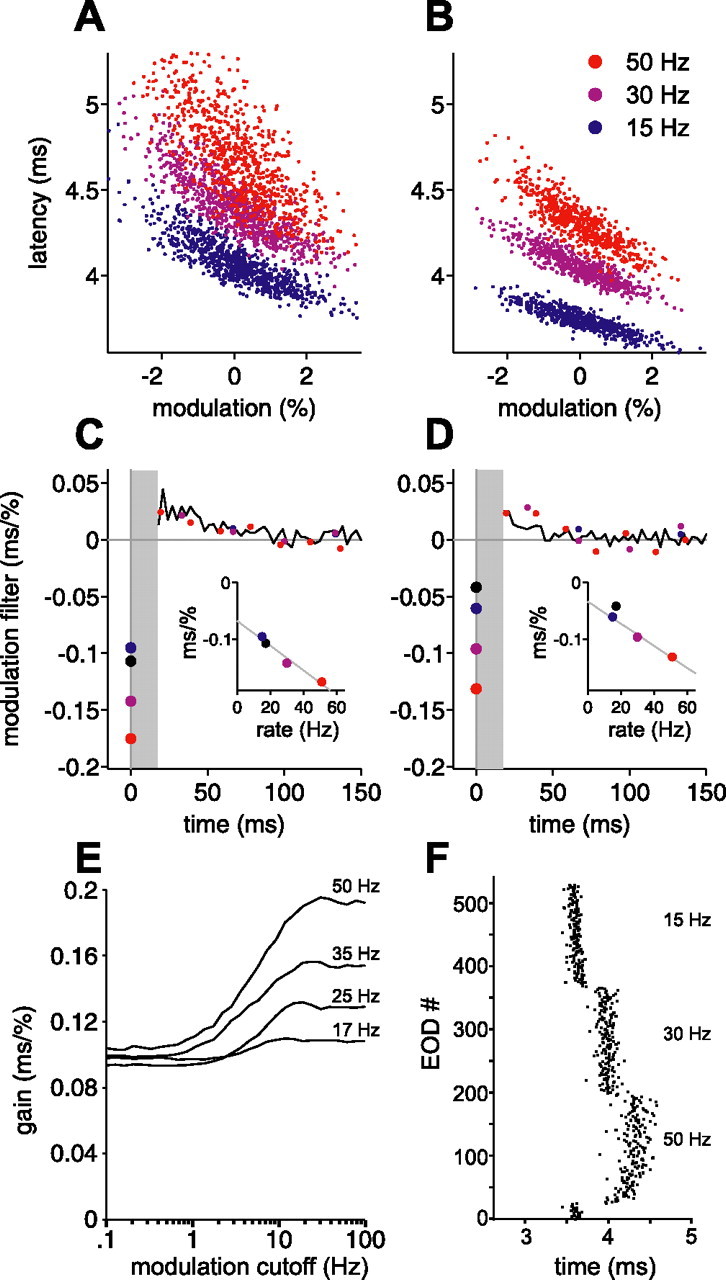
Sensitivity to present EOD amplitude increases linearly with constant EOD rate. A, B, Actual latency versus present EOD modulation amplitude for two afferents, at constant EOD rates of 15 Hz (blue), 30 Hz (purple), and 50 Hz (red), for independent amplitude modulations. Note the steeper slope (gain) at higher rates. C, D, Modulation filters for the afferents in A and B, for these three constant intervals. Modulation filters for independent intervals for the same afferents are shown in black. Sensitivity to present amplitude modulation (circles at time 0) increases approximately linearly (insets) with increasing rate. Gray line in insets is a least-squares fit to the three constant-interval sensitivities. E, Calculated gain versus low-pass cutoff frequency of correlated amplitude modulations, for the white-noise modulation filter of the afferent in A and C with present amplitude sensitivity scaled according to the relationship in C, inset. Longer correlation times (lower cutoff frequencies) still lead to a loss of gain at all rates, but the loss at higher rates is no worse than at lower rates; compare with Figure 10H, which is based on the white-noise filter for the same afferent. F, A portion of the protocol used for the afferent in B. Note the longer mean latencies at higher rates, with both rapid and slower phases of drift after a change in rate. Only the second half of each constant-rate block was used for analysis.