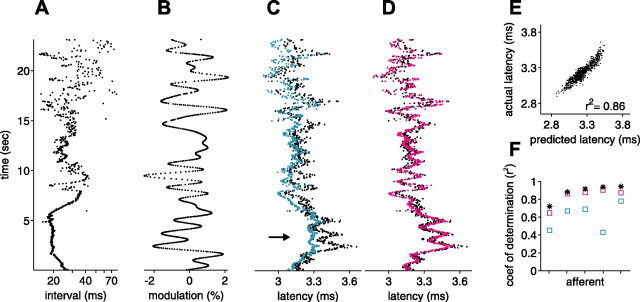
Figure 12.
White-noise filter predictions for natural intervals and correlated amplitudes can be substantially improved by incorporating interval-dependent amplitude sensitivity changes. A, Natural interval sequence recorded in a behavioral experiment. B, Independent amplitude modulations low-pass filtered at 1 Hz and sampled at the EOD times in A. C, Actual latency (black) and latency predicted by white-noise filters (blue) for the intervals and amplitudes shown in A and B, respectively. D, Actual latency (black) and latency predicted by white-noise filters (pink) incorporating both a constant shift and a scaling of sensitivity to present modulation amplitude by an amount proportional to the mean rate over the previous 3 s. E, Actual latency versus prediction from scaled filters; corresponding plot for unscaled filters is shown in Figure 9D. F, For five afferents, coefficient of determination between actual latency and latency predicted by white-noise filters on independent intervals and independent amplitudes (*), by white-noise filters on natural intervals and correlated amplitudes (blue square), and by scaled white-noise filters on natural intervals and correlated amplitudes (pink square). Interval-dependent scaling of sensitivity to present modulation amplitude increases prediction accuracy in all five afferents.

