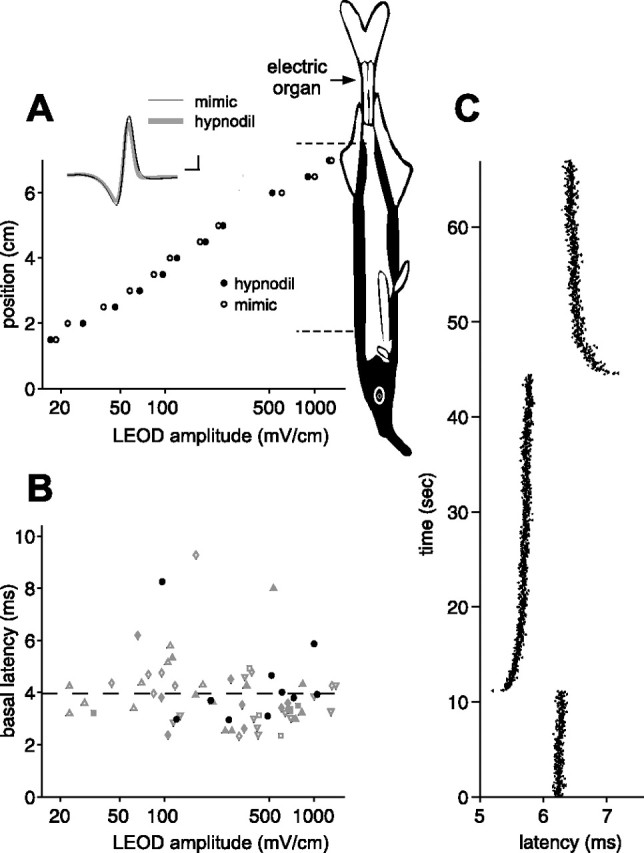
Figure 2.

Afferent spike latency adapts to the mean EOD amplitude. A, Comparison of LEOD amplitudes measured near the skin of the fish at different rostrocaudal positions (aligned with schematic of fish). LEODs resulting from the fish’s natural discharge were similar to those resulting from our mimic. Representative LEOD waveforms are shown in the inset. Calibration: 100 mV/cm, 0.1 ms. Schematic of the fish indicates the location of the electric organ and the regions of the skin containing electroreceptors (black). Dashed lines indicate the area of the skin innervated by afferents of the posterior lateral line nerve recorded in this study. B, Differences in baseline first spike latencies in response to the EOD mimic are uncorrelated with LEOD amplitude at the receptor. Each point represents a single afferent, and different symbols represent afferents from different fish. Black circles represent afferents recorded in a naturally discharging fish. C, Adaptation in afferent first spike latency to an abrupt 5% increase followed by an abrupt 5% decrease in EOD amplitude. EOD interval was held constant at 33 ms. Note that adaptation is initially rapid and then proceeds at a much slower rate.
