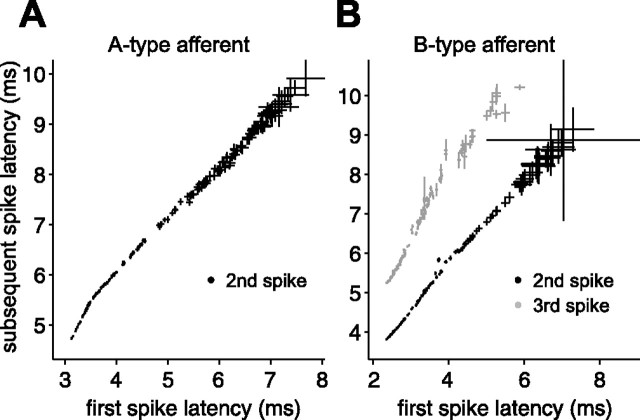
Figure 5.
Subsequent spikes in the afferent response do not carry additional information. A, Mean second spike latency versus mean first spike latency for a putative A-type afferent. Each point is based on responses to a different stretch of random EOD amplitudes and sensing intervals. Error bars are SEMs. B, Mean second and third spike latency (black and gray, respectively) versus mean first spike latency for a putative B-type afferent. In both A and B, subsequent spike latencies appear to be simple functions of (i.e., are correlated with) first spike latency.

