Figure 6.
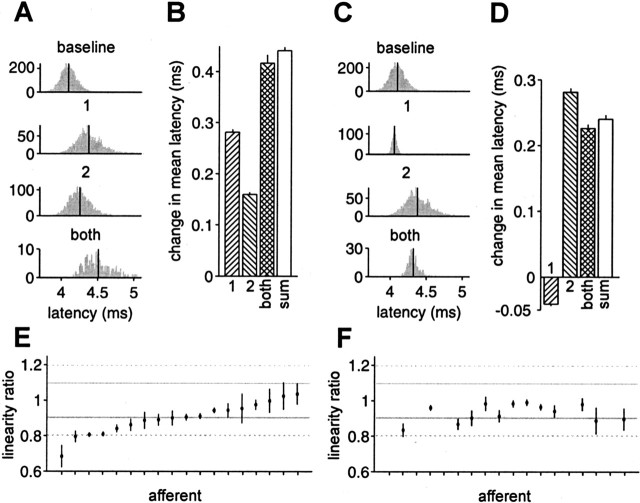
Approximate linear summation of effects of previous EOD intervals and present EOD amplitude. A, Histogram of latencies for the following (top to bottom): no previous EOD within 80 ms (baseline); one previous EOD, 17–32 ms before the present (1); one previous EOD, 32–47 ms before the present (2); and two previous EODs, one 17–32 ms before the present and one 32–47 ms before the present (both). Mean latency indicated by vertical line. B, Change in mean latency from baseline, for conditions 1, 2, and both, and the linear sum of 1 and 2 (sum). Error bars are SEMs. C, Histogram of latencies for the following (top to bottom): no previous EOD within 80 ms (baseline); present EOD amplitude larger than the mean (0.1–0.5% modulation) (1); one previous EOD, 17–32 ms before the present (2); and present EOD larger than the mean and one previous EOD, 17–32 ms before the present (both). D, Change in mean latency from baseline, for conditions 1, 2, and both, and the linear sum of 1 and 2 (sum). Data in A–D are from a representative afferent. E, Linearity ratios (see Results) for the effects of two previous EODs for 18 afferents. F, Linearity ratios for the effects of present EOD amplitude and previous EOD for the same afferents as in E, excluding those for which the effects of 1, 2, or sum were not statistically significant (p > 0.05). Gray lines indicate ±10% deviation from linearity, and dashed lines indicate ±20% deviation from linearity.

