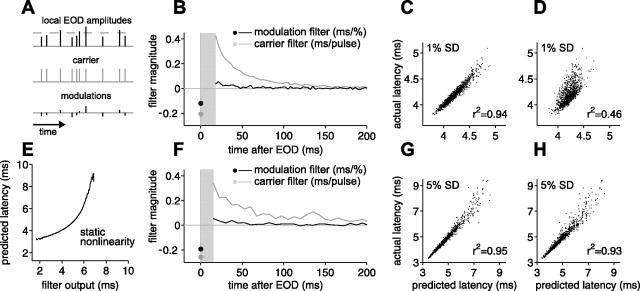
Figure 7.
Relative contributions of EOD amplitude and sensing intervals to afferent output revealed by a linear filter analysis. A, Schematic illustrating input to the electrosensory system as a carrier plus modulations. The temporal characteristics of the carrier are not fixed as the sequence of EOD intervals varies. B, F, Carrier and modulation filters for first spike latency for two different afferents, computed from experiments in which EODs were delivered at independent intervals (17–100 ms) with independent Gaussian amplitude modulation SDs of 1% (B) and 5% (F) of the unperturbed EOD amplitude. Sensitivity to present EOD amplitude modulation is indicated by the black circle. Sensitivity to past amplitude modulations is indicated by the black curve. Sensitivity to previous intervals is indicated by the gray curve. Aggregate sensitivity to all previous intervals is indicated by gray circle. Filters are not defined in gray region in which no EODs occur. E, Static nonlinearity mapping filter output onto predicted latency, for the afferent in F. C, G, Actual first spike latency versus latency predicted by the linear filters in B and F. D, H, Actual versus predicted first spike latency based on the present EOD amplitude alone.

