
Figure 9.
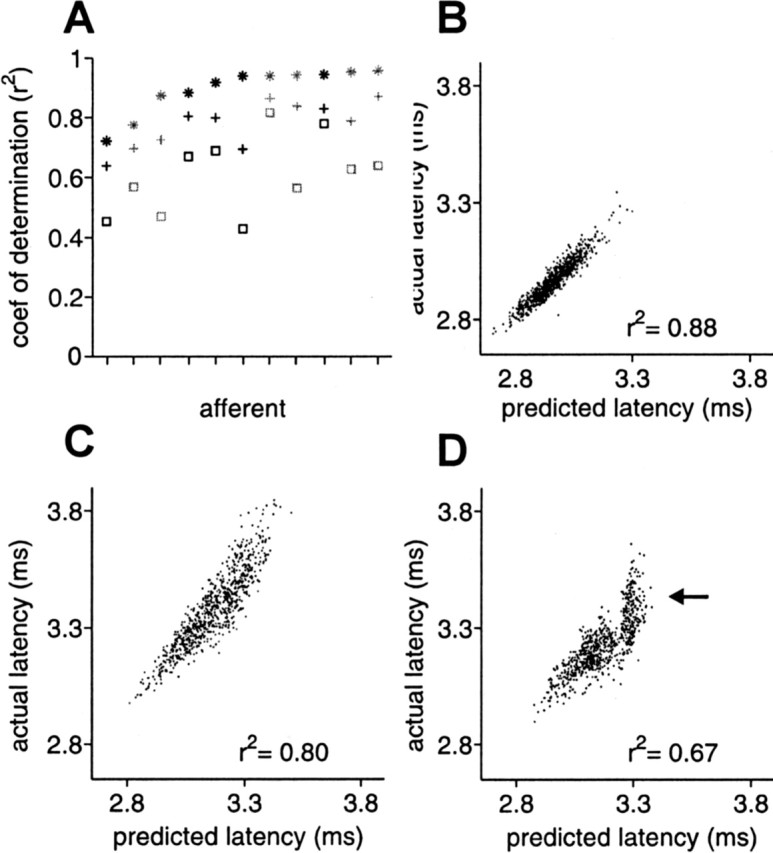
White-noise filters are partially successful in predicting response for natural EOD intervals. A, For 11 afferents, coefficient of determination between actual latency and latency predicted by white-noise filters, for independent intervals and independent amplitude modulations (*), for natural intervals and independent amplitude modulations (+), and for natural intervals and correlated (low-pass filtered at 1Hz) amplitude modulations (□). Gray symbols indicate filters augmented with a static nonlinearity. Prediction accuracy is lower for natural intervals and for correlated amplitude modulations. The natural interval sequence used in these experiments is shown in Figure 4A. B–D, Actual versus predicted latency in an example afferent, for independent intervals and independent amplitudes (B), natural intervals and independent amplitudes (C), and natural intervals and correlated amplitudes (D).