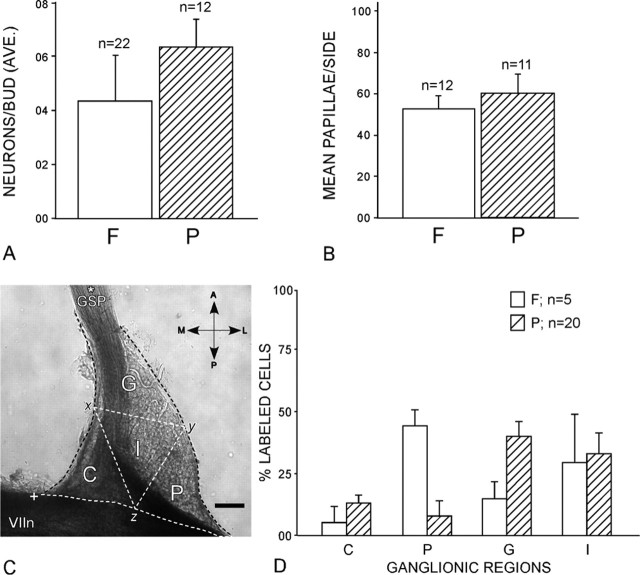
Figure 10.
A, The average (AVE.) number of geniculate ganglion cells innervating single buds in the palate (P) is similar to the number innervating fungiform buds (F). B, The numbers of taste buds per side in the fungiform lingual field (F) and in the palate (P) are equivalent. C, Regions of the ganglion in which labeled neurons were counted after fungiform or palatal bud injections (results in D). Each ganglion was mapped by dividing it into quadrants as follows: C, central region (i.e., toward the brain); G, GSP region (at its origin); P, peripheral region (the lateral ganglion); I, internal region. The locations are as follows: A, anterior; L, lateral; P, posterior; M, medial. The triangular quadrants were defined by lines connecting the midpoint of the central surface of the ganglion (x) with the midpoint of the lateral surface (y) and the midpoint of the surface adjacent to the facial nerve (z). Scale bar, 100 μm. D, Topographic differences are for the peripheral region (P), where fungiform-innervating neurons were more prevalent than palate-innervating neurons, and the GSP region (G), where palatal neurons predominated. The asterisk marks the GSP nerve, whereas the + symbol marks the central (toward brain) corner of the ganglia. VIIn marks the facial nerve. Error bars represent SDs.

