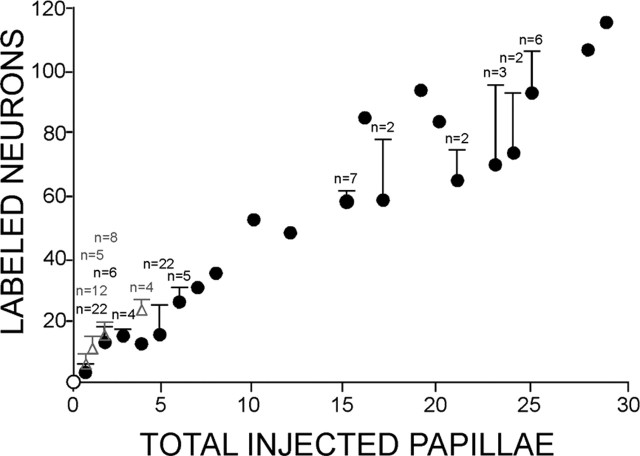
Figure 4.
The numbers of labeled geniculate ganglion cells increase proportionately with increasing numbers of injected papillae. This plot includes most of the data in the present series of experiments, including controls (open circle; chorda tympani nerve was cut before the injections). Filled circles with error bars represent averages for fungiform tongue injections; those without error bars are single cases. Gray triangles represent palatal bud injections. Error bars represent SDs for each type of experiment (e.g., one bud injected per animal, five buds injected per animal, etc.; n = number of cases by type).

