
Figure 7.
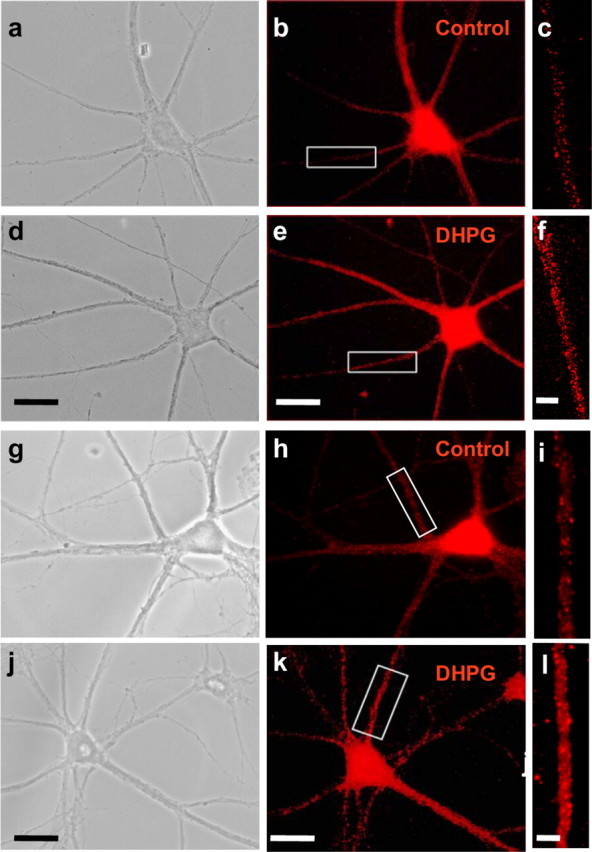
Group I mGluR1 activation enhances levels of GluR2 and GluR1 mRNA in dendrites. a–f, Representative images showing GluR2 mRNA in control (b, c) and DHPG-treated (e, f) neurons, as assessed by Q-FISH at 30 min after initiation of drug treatment. DHPG (25 μm plus 50 μm d-APV and 100 μm CNQX) was applied for 15 min. b, e, GluR2 mRNA fluorescence is prominent in the soma and dendrites of the same neurons shown under phase optics in a and d, respectively. c, f, Enlarged view of areas indicated in boxes in b and e, respectively. g–l, Representative images showing GluR1 mRNA fluorescence in a control (g–i) and DHPG-treated (j–l) neuron, as assessed by Q-FISH at 30 min after initiation of drug treatment. h, k, GluR1 mRNA fluorescence in the soma and dendrites of the same neurons shown under phase optics in g and j, respectively. i, l, Enlarged view of areas indicated in boxes in h and k, respectively. Activation of group I mGluRs markedly enhanced GluR2 and GluR1 mRNA fluorescence intensity in proximal and distal dendrites of hippocampal neurons, with no significant change in cell soma. Error bars represent SEMs for 10 (GluR2 mRNA) and 3 (GluR1 mRNA) independent experiments, each involving a minimum of 20 cells per treatment group (**p ≤ 0.01). Scale bars: b, e, h, k, 20 μm; c, f, i, l, 2 μm.