Figure 2.
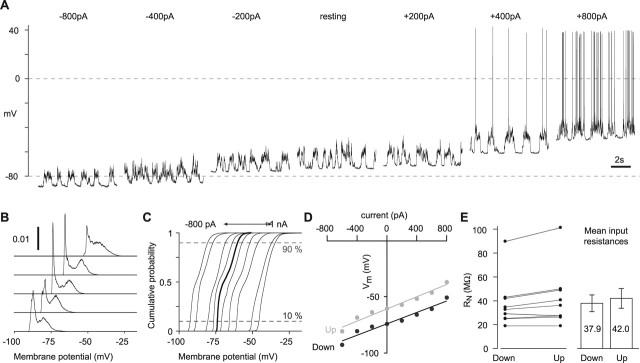
Parallel shift of Up and Down states with constant holding currents. A, Membrane potential recordings from a single L2/3 neuron during hyperpolarizing and depolarizing constant current injections from −0.8 to +0.8 nA (indicated above each trace). B, Membrane potential histograms for the neuron shown in A. Bin width, 0.1 mV. For clarity, only histograms for current injections of −0.8, −0.4, zero, +0.4, and +0.8 nA are shown. Histogram integrals are normalized to 1. C, Cumulative membrane potential histograms for the same neuron. Ten current injections from −800 pA to +1 nA (in 200 pA steps) are shown. The thicker line denotes the histogram at resting membrane potential. The dashed horizontal lines indicate the 10th and 90th percentiles. D, V–I plots for 10th (black markers) and 90th (gray markers) percentiles, derived from the cumulative membrane potential histograms in C. The slopes of the fitted lines give input resistances in Down (black line) and Up (gray line) state, respectively. E, Comparison of input resistances measured by constant current injection during Up and Down states for nine neurons. Left, Individual experiments. Right, Mean ± SEM.

