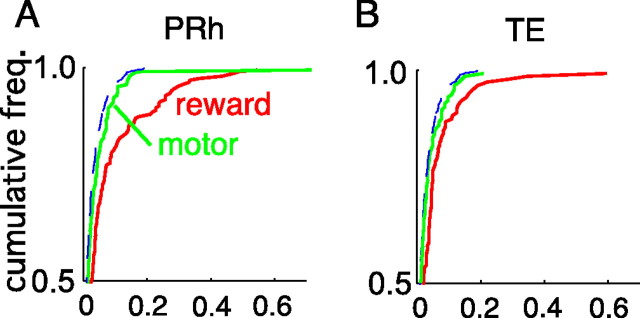
Figure 8.
Comparison of the strength of motor dependence with that of reward dependence in PRh (A) and TE (B). The green lines show the cumulative frequency of the cell in terms of the strength of motor dependence, calculated by the ratio of the variance attributable to motor conditions to the total variance but excluding the trial variance (m(t))2/2[(m(t))2/2 + (r(t))2/2 + v(t)]. The red lines show the cumulative frequency of the cell in terms of the strength of reward dependence (r(t))2/2[(m(t))2/2 + (r(t))2/2 + v(t)]. The variances of responses were calculated in a window from 100 to 500 ms after the stimulus onset. The broken lines indicate the theoretical distribution of false dependence originating in visual stimulus selectivity. The motor dependence was smaller than the reward dependence in both areas.

