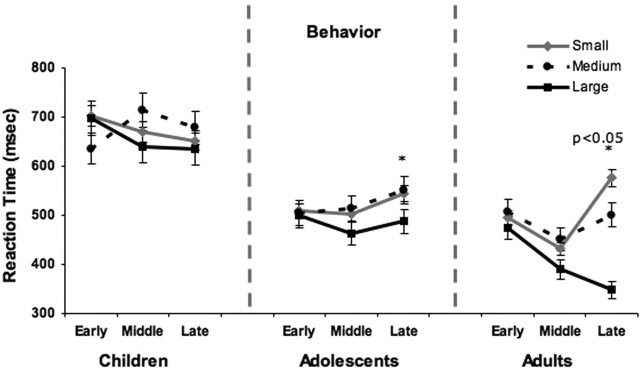
Figure 8.
Behavioral results. Mean reaction time as a function of small, medium, and large reward values are shown for early, middle, and late trials of the experiment for each age group. Error bars indicate SEM. Asterisks denote slower reaction time to small and medium rewards relative to small in adolescents and slower reaction time to small relative to medium and medium relative to large in adults.

