Figure 5.
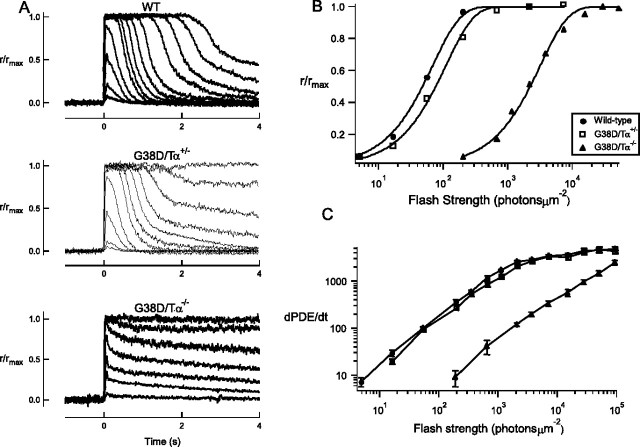
A, Flash responses from wild-type, G38D/Tα+/−, and G38D/Tα−/− rods. Suction electrodes were used to record light responses from single dark-adapted rods. The normalized responses to increasing flash strengths of light from representative wild-type, G38D/Tα+/−, and G38D/Tα−/ rods are shown. Maximal response amplitudes (rmax in picoamperes) for these rods were 14.3 (wild type), 13.6 (G38D/Tα+/−), and 15.8 (G38D/Tα−/−). Ten-millisecond flashes of light (500 nm) were given at t = 0 and ranged in strength from 5 to 97,000 photons μm−2 for wild-type and G38D/Tα+/− rods and from 650 to 94,000 photons μm−2 for G38D/Tα−/− rods. B, Plot of normalized response amplitude as a function of flash strength for representative rods. The flash strengths required to elicit a half-maximal response (Io in photons μm−2) for these cells were 48 (wild type), 77 (G38D/Tα+/−), and 2219 (G38D/Tα−/−). C, The slope of the light-evoked rise in PDE6 activity (dPDE*/dt) in response to flashes of light is plotted with respect to the flash strength of the stimulus (photons μm−2). The data were collected from 12 wild-type, 17 G38D/Tα+/−, and 19 G38D/Tα−/− rods. Because every flash strength was not presented to every cell, each point is the average of at least four values ±SEM.

