
Figure 4.
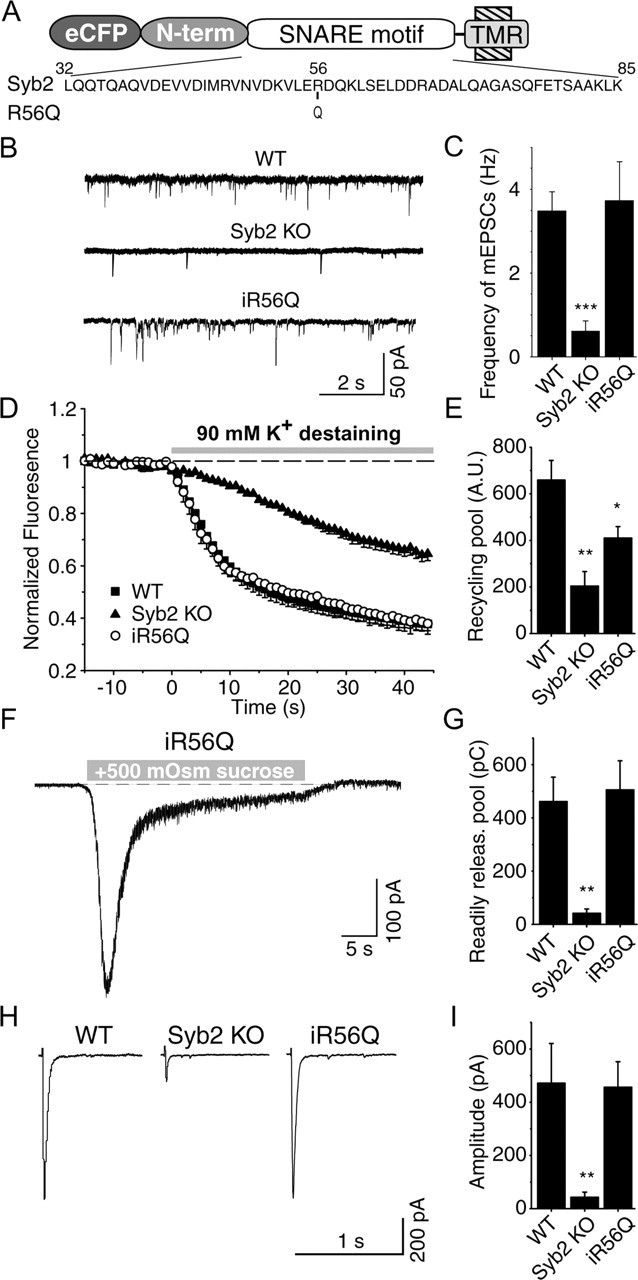
R56Q point mutation does not affect synaptobrevin 2 function. A, Diagram of the point mutation at the zero layer of SNARE motif, in which the 56arginine was mutated to glutamine. TMR, Transmembrane region. B, Representative traces of spontaneous synaptic events recorded from a cell infected with R56Q mutant form of synaptobrevin 2. C, Frequency of spontaneous synaptic events (n = 12 R56Q infected; n = 15 12-insertion infected KO cells; n = 10 24-insertion infected KO cells). D, Average destaining curves of FM2-10-loaded synapses during high potassium stimulation. E, Bar graphs depict size of recycling pool as mean ± SEM for WT (n = 16, 1146 synapses), synaptobrevin 2 KO (n = 11, 688 synapses) synapses, and KO synapses after infection with eCFP–synaptobrevin 2–R56Q (n = 3, 126 synapses). F, A representative recording of synaptic responses to hypertonic sucrose (+0.5 Osm) application in a synaptobrevin 2 KO culture rescued with the R56Q mutant. G, Summary graph of synaptic responses to hypertonic sucrose monitored in infected neurons. Abbreviations used are the same as in C. Responses are calculated as the cumulative charge transfer integrated over 1 s interval at the peak of the response (n = 6 R56Q infected). H, Representative traces from whole-cell recordings during 1 Hz field stimulations. I, Amplitudes of evoked responses (n = 7 WT and synaptobrevin 2 KO cells; n = 11 R56Q infected cells).