
Figure 3.
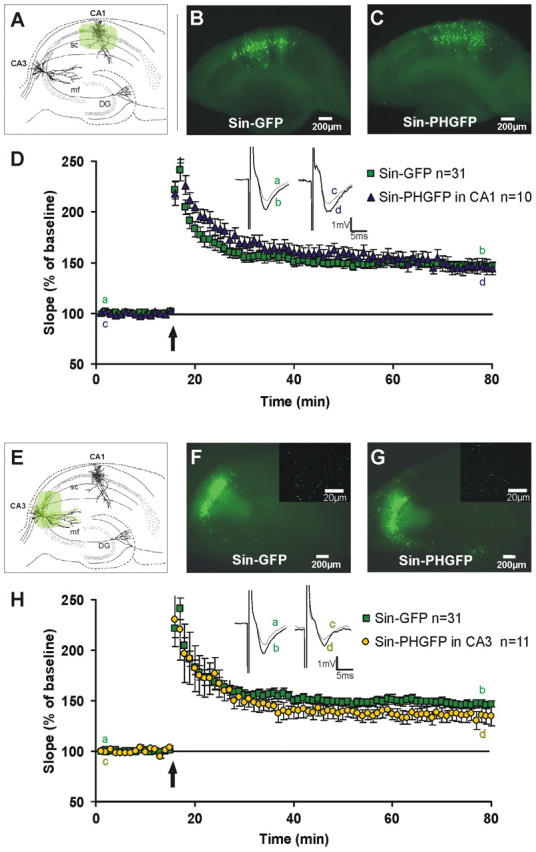
Local expression of the PLCγPH domain exclusively in area CA1 or exclusively CA3 does not decrease LTP significantly. Schematic and representative images of acute hippocampal slices injected in area CA1 (A–C) or CA3 (E–G) with either Sin–GFP (B, F) or Sin–PHGFP (C, G) are shown. No apparent difference was observable between extent and intensity of transgene expression in Sin–GFP- or Sin–PHGFP-transduced slices. After at least 6 h of incubation, Schaffer collaterals were stimulated and fEPSPs recorded in area CA1. EPSP slope size is shown before and after tetanic stimulation (3 × 30 pulses; 100 Hz; arrow) for Sin–PHGFP and Sin–GFP control slices in CA1 (D) and CA3 (H). There is no significant difference between Sin–GFP and Sin–PHGFP 55–60 min after tetanic stimulation (p > 0.1 for CA1 and CA3, t test). D, H, Insets show original sweeps from representative individual experiments. Letters correspond to the time point when traces were taken. F, G, Insets show axonal labeling of Sin–GFP and Sin–PHGFP, respectively. Error bars represent SEM. DG, Dentate gyrus; mf, mossy fibers; sc, Schaffer collaterals.