
Figure 5.
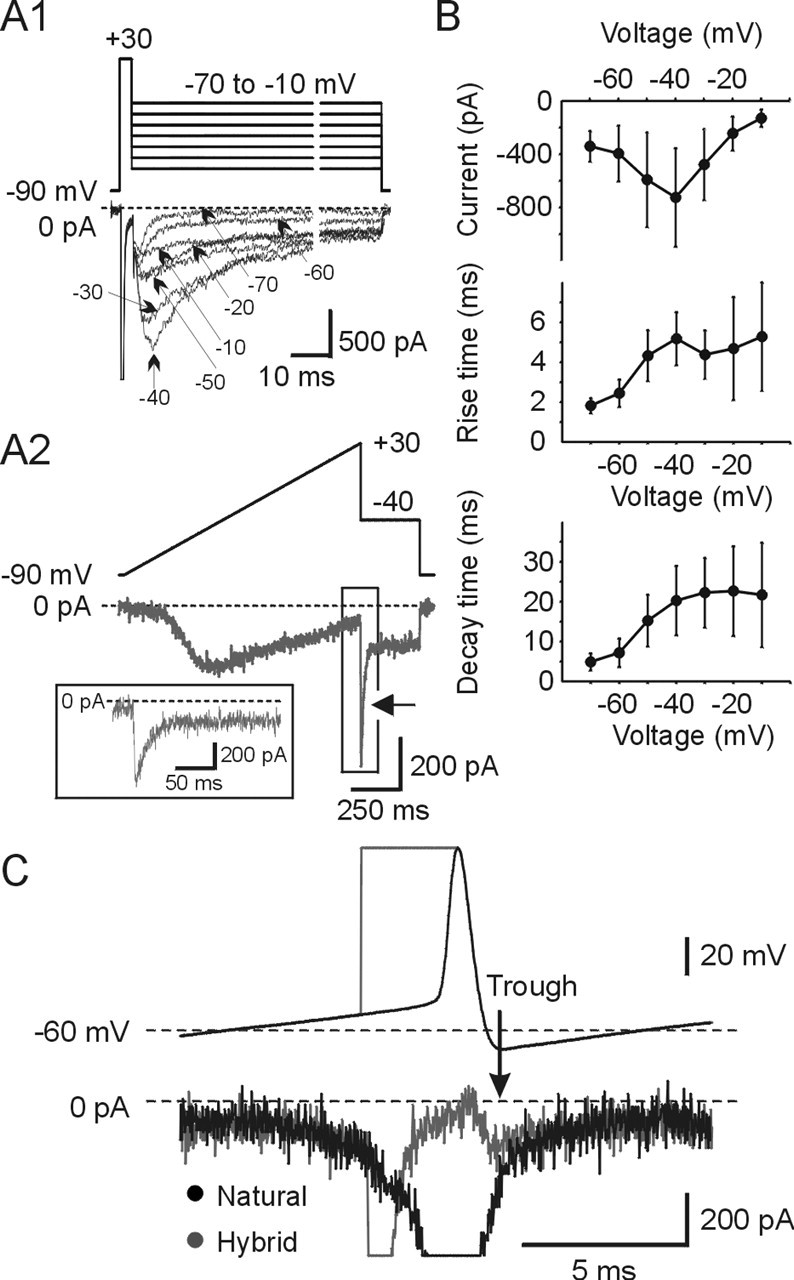
Mes V neurons show resurgent sodium currents. A1, The top trace shows voltage protocol, and the bottom trace shows current response. INaT was evoked by a 3 ms step pulse from −90 to +30 mV. TTX-sensitive INaR was elicited when the membrane was repolarized to voltages between −70 and −10 mV after maximal fast inactivation. The data have been expanded for clarity, and the break in time is 10 ms. A2, TTX-sensitive sodium current was obtained by applying a slow ramp (−90 to +30 mV; 100 mV/s) followed by a step repolarization to −40 mV. INaR is evident after repolarization to −40 mV (arrow). The inset shows the expanded timescale of the boxed region in which INaR is present. B, TTX-sensitive INaR properties are voltage dependent. Relationships between peak INaR (top), rise time (middle), and decay time (bottom) versus repolarization command potential are shown. Error bars indicate SD. C, Relationship between resurgent sodium current components and total sodium current. The hybrid waveform protocols are shown on the top, and the current traces are shown below. Solid black is total sodium current evoked by template action potential, and the gray trace is current in response to a step pulse (3 ms) to inactivate INaT followed by the repolarization phase of the action potential. The isolated INaR (gray) was superimposed with the total sodium current (black). Note that these two traces overlapped at the peak of the AHP and for some time thereafter.