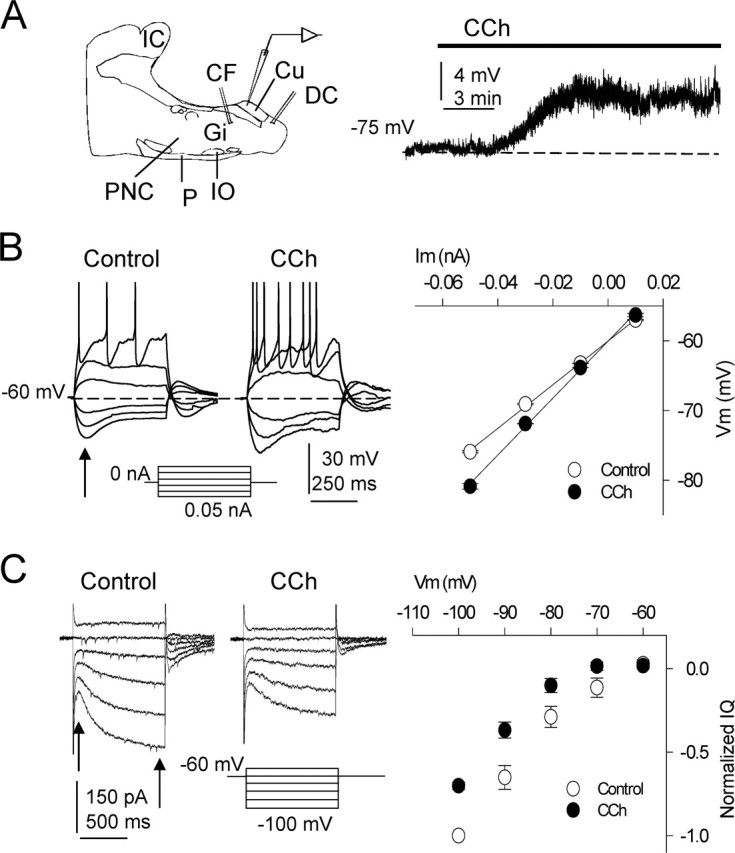
Figure 1.

Modifications of intrinsic properties induced by CCh. A, Left, Diagram of recording and stimulating electrode locations in the slice. CF, Corticofugal fibers; Cu, cuneate nucleus; CF, cuneate fasciculus; DC, dorsal column fibers; Gi, gigantocellular reticular nucleus; IC, inferior colliculus; IO, inferior olive; P, pyramidal tract; PnC, caudal pontine reticular nucleus. A, Right, Superfusion with CCh (10 μm) depolarized DC neurons. B, Left, Current-clamp responses evoked by hyperpolarizing and depolarizing current pulses in control ACSF and during CCh in a representative experiment. The cell was returned to the resting potential by injecting a sustained current during the CCh-induced depolarization. Note the larger hyperpolarizing responses, the increased excitability, and the lower current spike threshold with CCh. B, Right, Average I–V relationships (n = 9) calculated with hyperpolarizing and depolarizing current pulses in control ACSF (open circles) and with 10 μm CCh (filled circles). The values were measured at the peak hyperpolarization (arrow in B, left) and were well fitted to a linear regression showing the steeper slope with CCh, indicating an increased membrane resistance (n = 9; p < 0.01). C, Left, Representative voltage-clamp recordings evoked by hyperpolarizing and depolarizing voltage commands in control ACSF and during 10 μm CCh. Hyperpolarization activated a slowly increasing non-inactivating inward current (i.e., Q-current) that was markedly inhibited by CCh. C, Right, Average I–V relationship in control ACSF (open circles) and with CCh (filled circles) showing the CCh-induced inhibition of the Q-current (n = 9; p < 0.01). Values were the difference between currents at onset and end of voltage commands (arrows) and normalized to the largest control current (n = 20; p < 0.01). The resting Vm is indicated in each current-clamp record, as in the following figures.
