Figure 8.

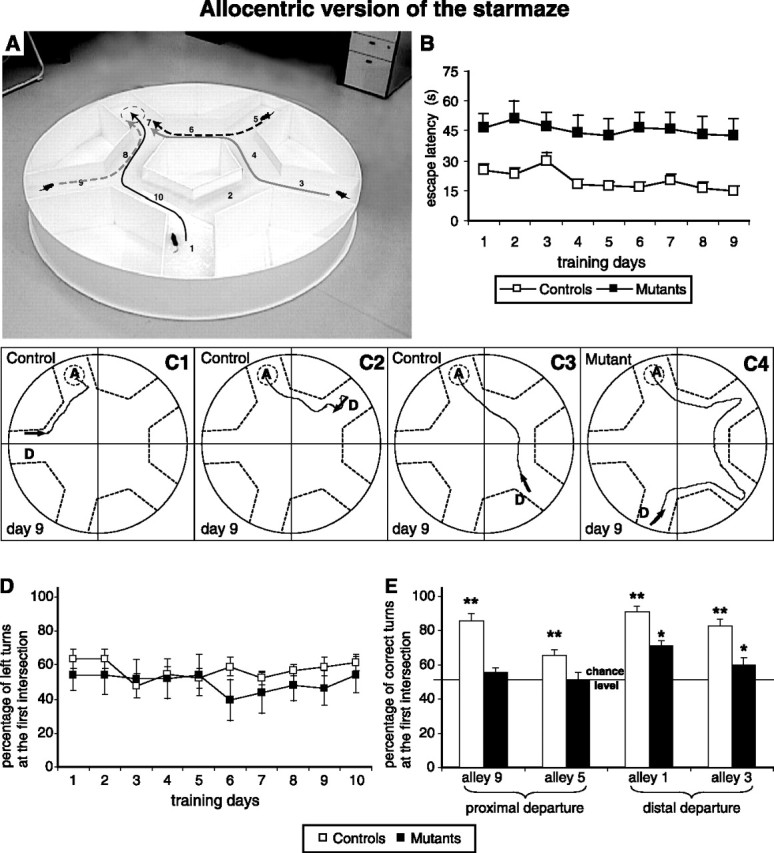
A, The allocentric version of the starmaze. The four possible randomly chosen departure locations are represented by the mice. B, The time to reach the escape platform (in seconds) is plotted as a function of training days for controls (n = 11) and mutants (n = 12). Each training day represents the average of the scores obtained during the four trials of a day. C1, C2, C3, An example of a control mouse using the shortest trajectory to reach the target alley (represented by a dashed circle) from different random departure points (represented by an arrow). In contrast, C4 is an example of the trajectory of a NR1-KO mouse, which did resort to a serial strategy to reach the target alley. D, The percentage of left turns at the first intersection. For each training day, the percentage corresponds to the mean ± SEM of the score obtained by all animals of a group at the four departure points. E, The percentage of turns toward the platform location (correct turns) at the first intersection encountered depending on the four different departure points. An asterisk denotes a significant difference between NR1-KO mice and chance level. Two asterisks indicate that the score of controls was significantly different from both NR1-KO mice and chance level (ANOVA and post hoc analysis; p < 0.05).
