
Figure 6.
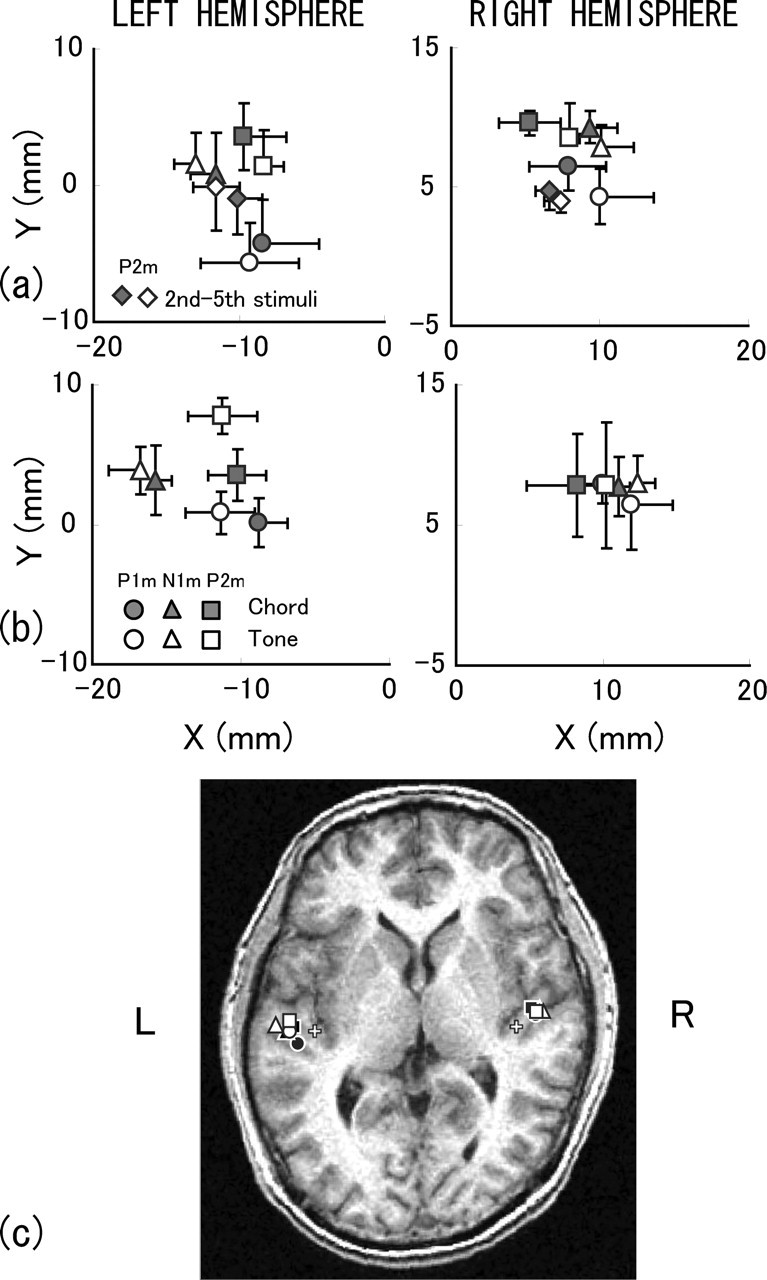
Grand mean location of ECDs of the first-stimulus response obtained in the EP (a) and NE (b) groups. ECDs of the second to fifth stimuli responses are also shown for the P2m component in the EP group. Error bars indicate the range of SEs, which are omitted in some cases for clarity. The x- and y-axes are along the medial–lateral and anterior–superior directions, respectively. c, Grand mean location of ECDs superposed on an axial MR image of one subject. White crosses indicate the center of PAC at a medial portion of HG, which served as a reference point of anatomical structure.