
Figure 1.
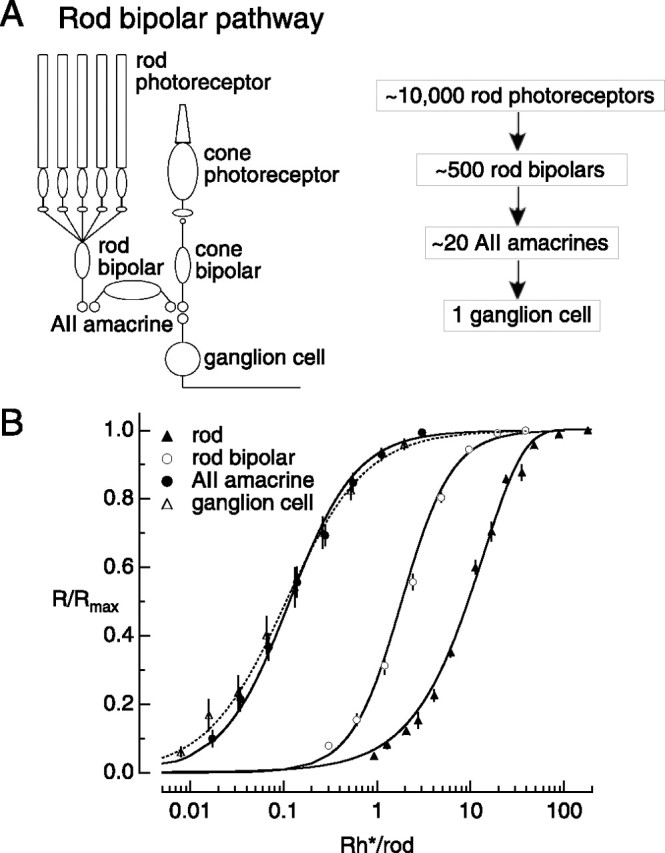
Stimulus–response relationships for cells in the rod bipolar pathway. A, Schematic of the mammalian rod bipolar pathway and estimates of convergence [cat (Sterling et al., 1988); mouse (Tsukamoto et al., 2001)]. Most synapses are glutamatergic, with the exceptions of electrical coupling between the AII amacrine and on cone bipolar, and a glycinergic synapse between the AII amacrine and off cone bipolar (Strettoi et al., 1992) (for review, see Bloomfield and Dacheux, 2001). B, Stimulus–response relationships for cells across the rod bipolar pathway in mouse retina. Points plot average responses (mean ± SEM) to a 10 ms flash delivered in darkness. The rod stimulus–response relationship was fit with a saturating exponential with φhalf = 9.6 ± 0.2 Rh* (N = 22). Stimulus–response relationships for on α ganglion cells, AII amacrine cells, and rod bipolar cells were fit with a Hill curve (Eq. 1). Half-saturating flash strengths, φhalf, and the exponent, n, were φhalf = 1.83 ± 0.06 Rh*/rod and n = 1.6 ± 0.04 for rod bipolar cells (N = 43), φhalf = 0.12 ± 0.01 Rh*/rod and n = 1.20 ± 0.06 for AII amacrine cells (N = 12), and φhalf = 0.11 ± 0.01 Rh*/rod and n = 1.01 ± 0.06 for ganglion cells (N = 9).