
Figure 9.
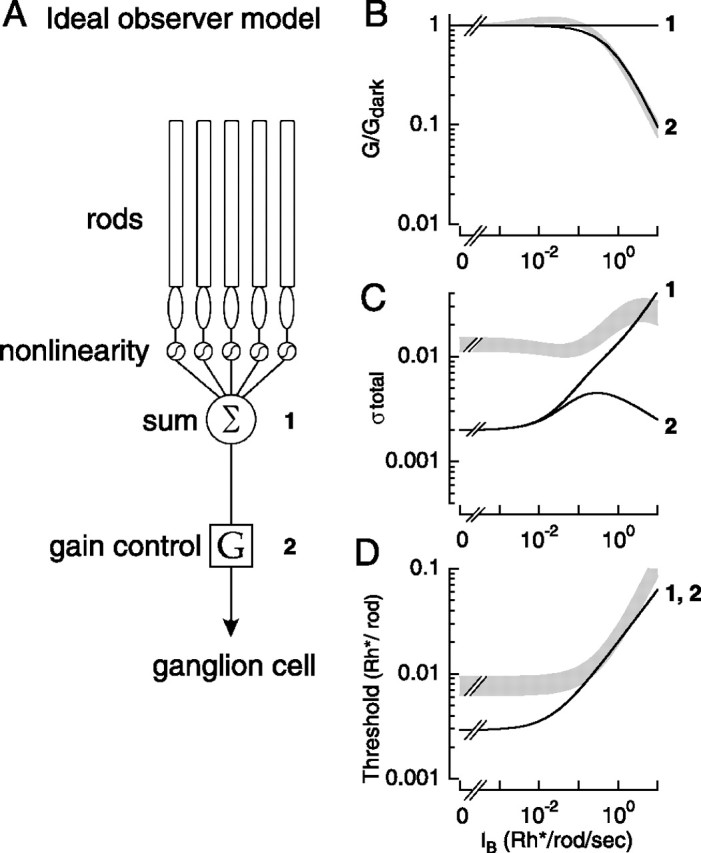
Comparison of experiment with ideal-observer predictions. A, Noise and threshold were predicted by passing simulated rod responses through a nonlinearity, summing N signals, and applying a gain change. Location 1 represents the signal before the gain change, and location 2 represents the signal after. The nonlinearity was a cumulative Gaussian (midpoint of 1.3; SD of 0.1). N was 4096 for α ganglion cell predictions. B, Response gain before (1) and after (2) the gain control site. Gray region shows fits to upper (measured + SEM) and lower (measured − SEM) limits to the measured gain from Figure 5A. Gain in the model was chosen to match that measured and scaled with background as (0.3 + IB)−0.8. C, Total flash-independent and flash-dependent noise at threshold of the model before (1) and after (2) the gain change. Gray region shows fits to upper (measured + SEM) and lower (measured − SEM) limits to the measured total noise from Figure 5, B and C. D, Threshold of the ideal-observer model (black) compared with fits to the upper (measured + SEM) and lower (measured − SEM) limits to the measured threshold from Figure 5D (gray region).