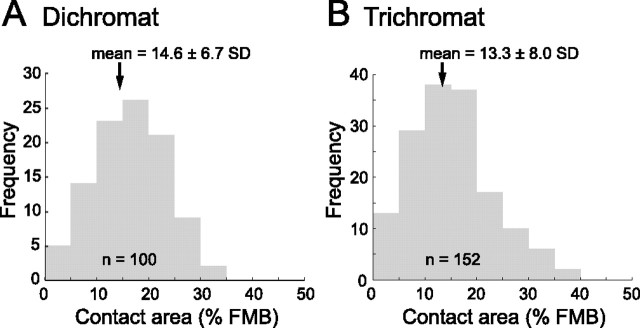
Figure 11.
Frequency histograms showing the proportion of FMB axons colocalized with ganglion cell dendrites in dichromats and trichromats. Only FMB cells with >50% of their axon terminals within the dendritic field are included. The mean and SD for each distribution is indicated by an arrow. n, Total number of FMB cells analyzed.

