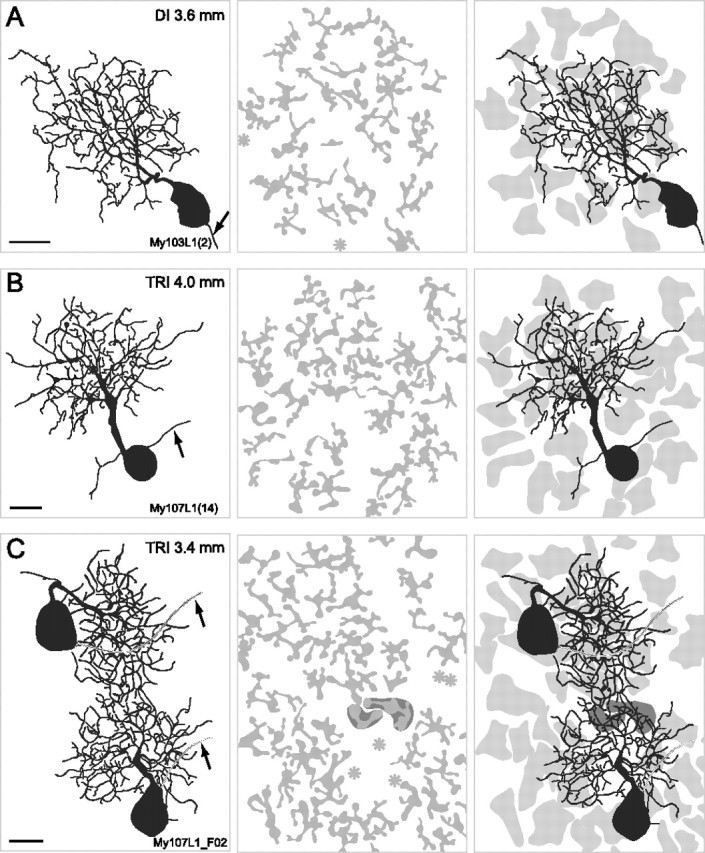
Figure 4.

Drawings of reconstructed OFF-midget ganglion cells and the corresponding FMB axon terminals in dichromatic (DI) and trichromatic (TRI) animals. The left column shows the midget ganglion cells. The middle column shows the FMB axon terminals. The right column shows the ganglion cells together with the outlines of the axon terminals (light gray). Eccentricities are indicated in the top right corner. Arrows point to the axon of the ganglion cell, asterisks indicate the location of midget bipolar axons where the axon terminal was too weakly labeled to be traced. The two neighboring ganglion cells in C share two bipolar axon terminals (dark gray outline) (see also Fig. 10 B–D). Scale bars, 10 μm.
