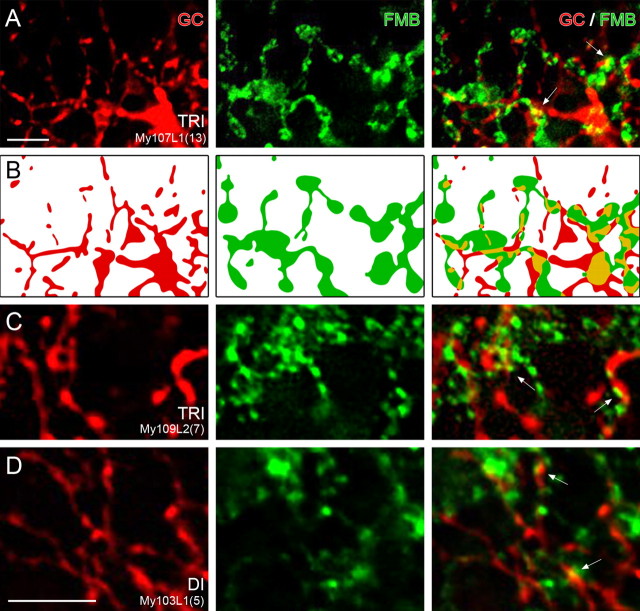
Figure 9.
Contact areas between OFF midget ganglion cells (GCs) and FMB axon terminals. Whole mount view of single images of a deconvolved stack of images are shown. A, Micrographs of retrogradely labeled OFF-midget ganglion cells together with CD15-labeled FMB axons in trichromatic (TRI) marmoset. The left column shows the ganglion cell dendrites (red), the middle column shows two FMB axon terminals (green), and the right column shows the superposition of the two channels. The arrows point to regions of colocalization. B, Schematic drawing of the labeled processes in focus in A. The colocalized areas are drawn in yellow. C, D, High-resolution images of midget ganglion cell dendrites (red) and FMB axon terminals (green) in dichromatic (DI) and trichromatic (TRI) marmosets at the same level of focus. The superposition of the two images is shown in the right column. The areas of contact are indicated by arrows. Scale bars: A (for A, B), D (for C, D), 5 μm.

