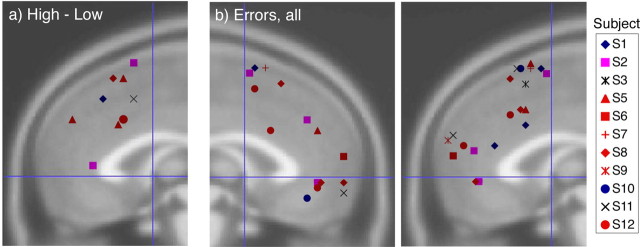
Figure 5.
Individual subject results for error processing. a, Peak activation foci for each subject (legend on the left of figure) for the high − low contrast, plotted on the right MFC for x = −3 to +18. No foci appeared for x < −3 in this contrast. b, Activation foci for error − correct contrasts are plotted on the left MFC (left) from x = +3 to −18 and on the right MFC (right) for x = −3 to +18.

