
Figure 2.
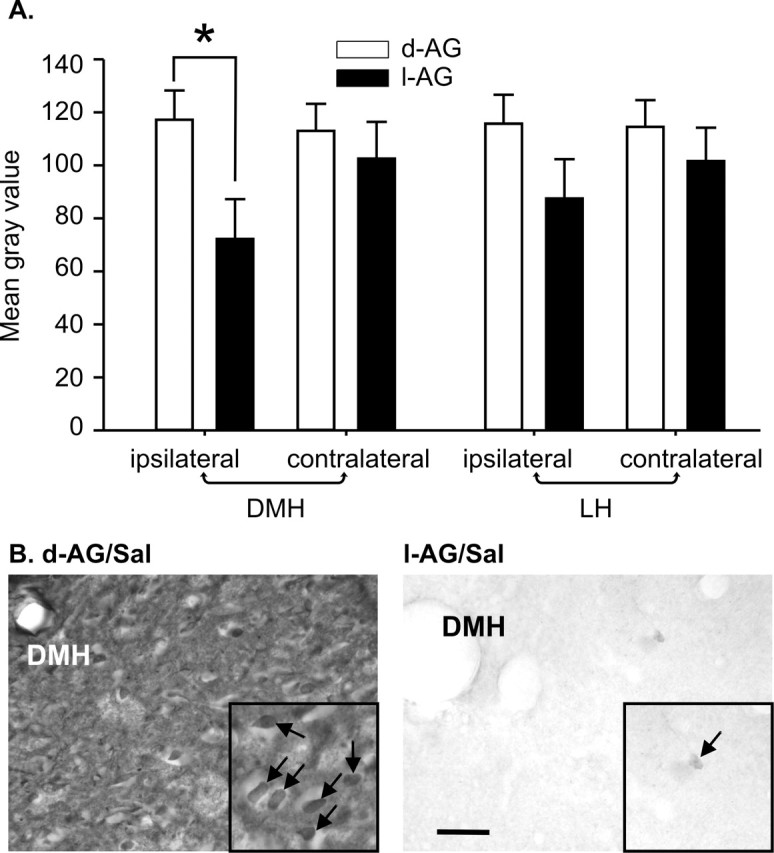
The effect that GABA synthesis inhibition (l-AG) or d-AG controls had on the intensity of GABA immunostaining in the DMH and LH. A, Mean brightness of GABA immunostaining ipsilateral and contralateral to minipump cannulas in the DMH and LH. Values of the bars represent the mean gray scale value; error bars represent the SEM (∗p < 0.002). B, High-magnification photographs of GABA-IR cells adjacent to the minipump cannula in the DMH in d-AG/Sal-treated (left) and l-AG/Sal-treated (right) rats. Small photographic insets in B are cropped and enlarged images taken from original left and right photographs at higher magnification. Arrows in photographic insets indicate GABA-IR cells. Scale bars: B, 200 μm; B, bottom left inset, 50 μm; B, bottom right inset, 20 μm.