
Figure 6.
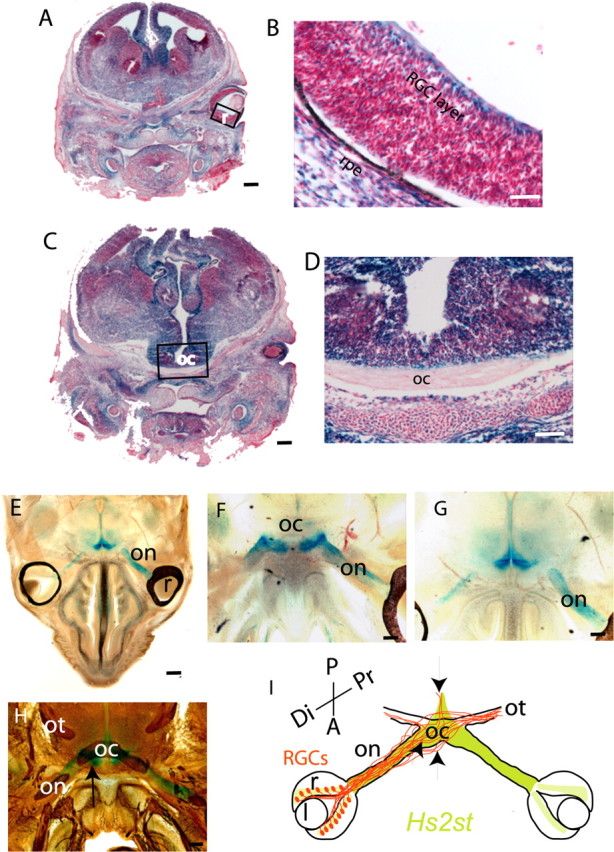
Hs2st expression in the retina and at the optic chiasm revealed by X-gal staining of E15.5 Hs2st+/LacZ sections. A–D, Thin (10 μm) coronal cryostat sections stained to completion. Hs2st is expressed widely in neural and non-neural tissues, although there is considerable variation in staining intensity between different regions. A, B, LacZ staining in the RGC layer of the retina. The boxed area in A is magnified in B. C, D, LacZ staining of cells around the optic chiasm. The boxed area in C is magnified in D. E–H, Thick (200 μm) horizontal vibratome sections through E15.5 Hs2st+/LacZ embryos in which X-gal staining was stopped before it reached completion to reveal sites of strong expression. E, Low-power view showing staining in cells surrounding the optic nerve and at the ventral midline but not in the retina. F, G, Higher magnification of consecutive sections showing staining in cells surrounding the optic nerve and at the point at which the optic nerve contacts the brain (F) and a more dorsal section showing staining dorsal and posterior to the chiasm (G). H, Section double stained with X-gal and anti-neurofilament antibody showing the relationship between neurofilament-stained RGC axons and the regions of X-gal staining. The arrow indicates coincidence between strong X-gal staining and neurofilament-labeled axons at the point at which the optic nerve joins the brain. I, Summary diagram of Hs2st expression (green). The trajectories of RGC axons (brown) at the optic chiasm in Hs2st−/− mutants is superimposed with arrows marking the coincidence between regions that normally express high levels of Hs2st and RGC axon navigation abnormalities when Hs2st function is lost (see Fig. 3). r, Retina; l, lens; on, optic nerve; oc, optic chiasm; ot, optic tract; Di, distal; Pr, proximal; A, anterior; P, posterior; rpe, retinal pigmented epithelium. Scale bars: A, C, E, 625 μm; D, F–H, 100 μm; B, 50 μm.