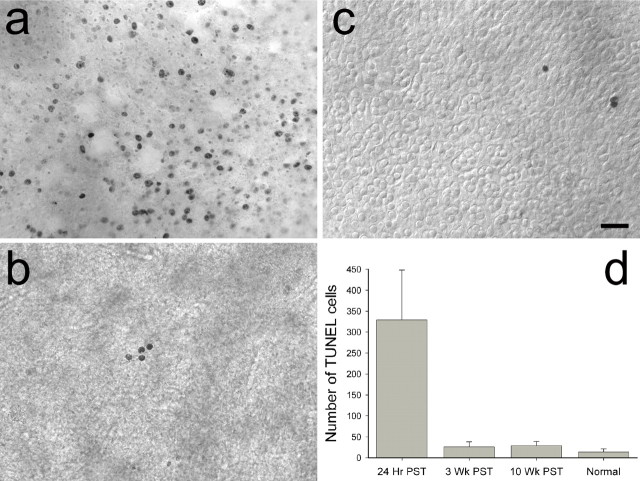
Figure 6.
Levels of apoptotic cells observed at different times during regeneration. TUNEL of DNA-fragmented cells are shown in the saccular striolar region at 24 h PST (a), utricular central extrastriola region at 3 weeks PST (b), and utricular striola–extrastriola border region in a normal pigeon (c). All images are dorsal views of whole-mount epithelia. In c, DIC optics allow visualization of calyceal terminal formations and the location of type II band. Scale bar, 25 μm. d, Plot of mean (±SD) number of TUNEL-labeled cells in the entire macula as a function of regeneration time.

