
Figure 4.
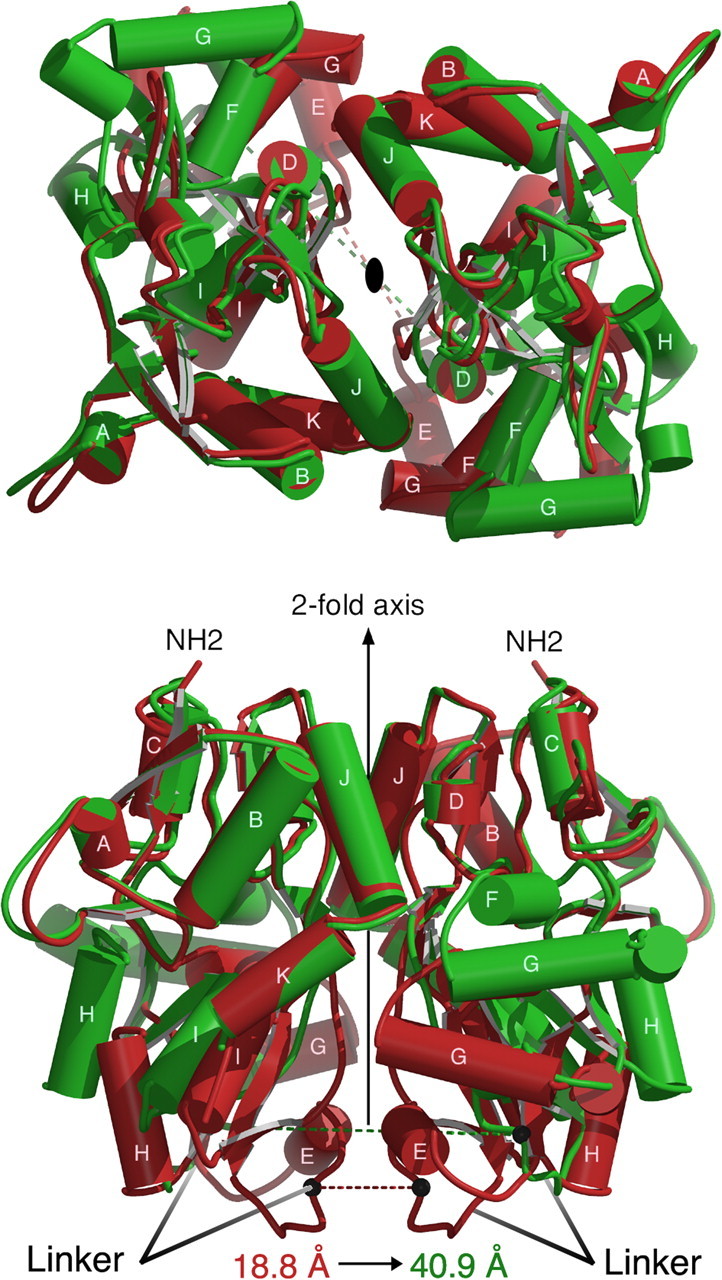
Agonist-induced conformational changes in the GluR5 dimer assembly illustrated by superposition using domain 1 Cα coordinates of the UBP310 (red) and the glutamate (green) complexes. The top panel is viewed from the N terminus looking down the twofold axis; the bottom panel shows a view from the side after rotation by 90°. The relative movement of the linker regions, which connect domain 2 to the ion channel pore, is represented by black spheres connected by red and green dashed lines, which show the difference in position of the Cα coordinates of Ile653 in the two structures. This distance increases from 18.8 Å in the UBP310 complex to 40.9 Å in the glutamate complex.