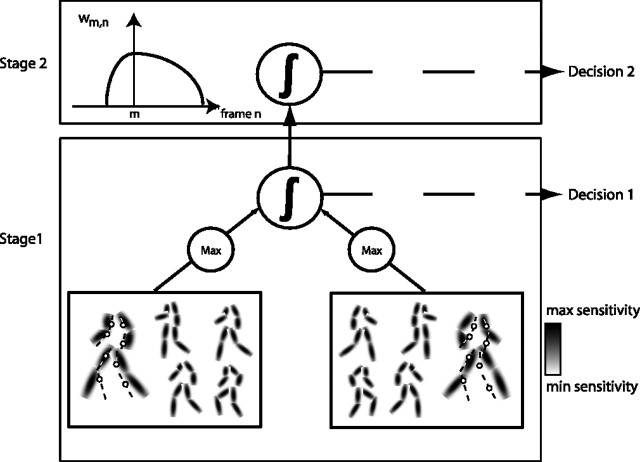
Figure 1.
Illustration of the model. Stage 1 consists of template cells for whole-body postures. Two sets of template cells represent walking to the left and walking to the right, respectively. Each set comprises static postures, with Gaussian response functions indicated by the shaded areas. The dots indicate the stimulus that is compared with the template by each template cell at each time step of stimulation. The dashed lines are only for illustration and not shown in the real stimulus. In each set, a winner-takes-all process selects the cell with maximum output at each time step. From the temporal integration of these maximum responses in the two sets, a decision about stimulus orientation is achieved as a first stage of analysis. This stage of analysis does not consider the temporal order of the stimulus postures. Analysis of temporal order is deferred to stage 2 and provides information for a decision on global motion aspects of the stimulus. This analysis is achieved by weighting the temporal differences between two consecutively selected frames (m,n) by the function wm,n (inset). This function weights adjacent frames more strongly than frames that are temporally separate. In addition, the function is asymmetric such that it weights frames that are in the preferred direction of the cell more strongly than frames that are in the temporally opposite direction.

