Figure 3.

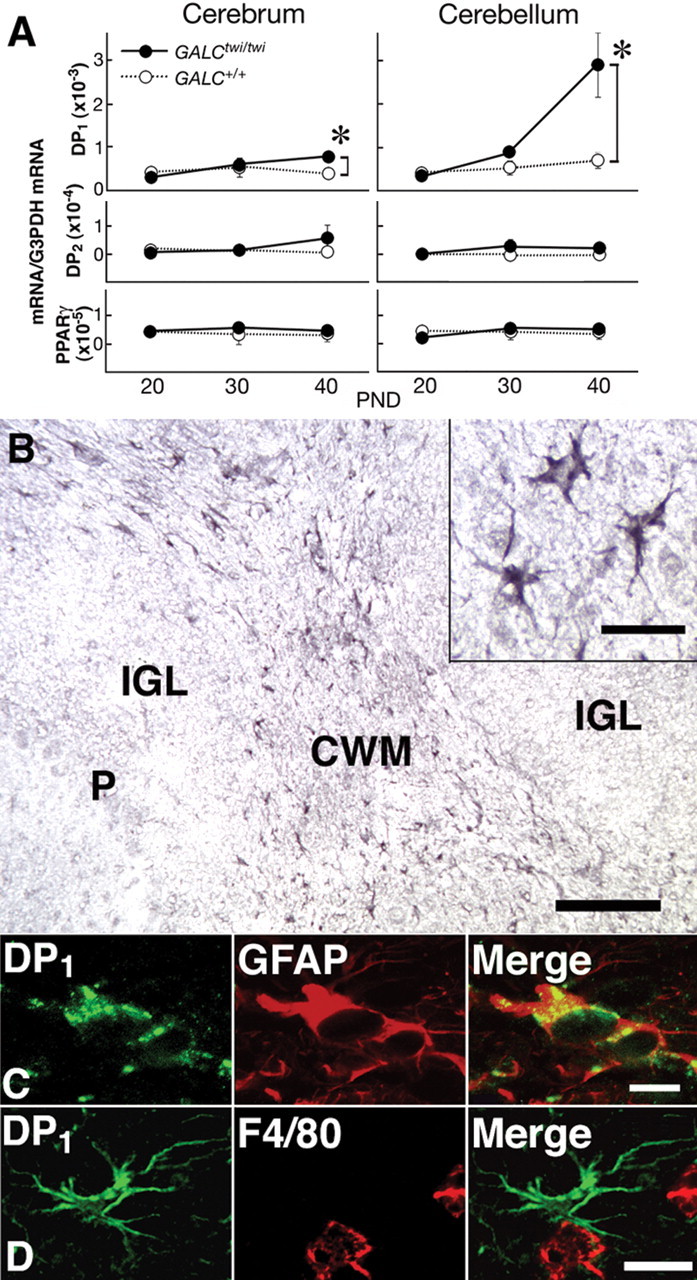
Induction of DP1 in GALCtwi/twi hypertrophic astrocytes. A, Quantitative PCR analysis of the contents of mRNAs for DP1, DP2, PPARγ, and G3PDH mRNA in GALC+/+ (white circles) and GALCtwi/twi (black circles) brains was performed by using a LightCycler amplification and detection system. n = 4. *p < 0.05. PND, Postnatal day. B, DP1 immunostaining in the GALCtwi/twi cerebellum at P45. DP1+ cells are recognized in the CWM but not in the internal granular layer (IGL) or Purkinje cell layer (P). Scale bar, 100 μm. Inset, High-power view of DP1+ cells. Scale bar, 10 μm. C, Double immunostaining for DP1 (green) and GFAP (red) in hypertrophied astrocytes. Scale bar, 5 μm. D, DP1+ astrocytes (green) and F4/80+ microglia (red) are intermingled in the CWM, although DP1 and F4/80 are not detectable in the same cells. Scale bar, 10 μm.
