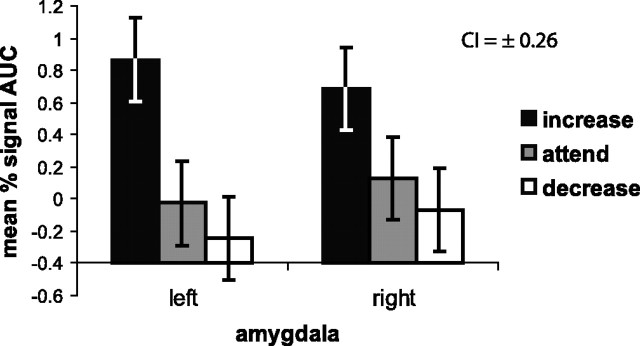
Figure 1.
Depicted here is the response of the left and right amygdala. On the ordinate, we plot the AUC for percentage signal change estimates from 5 to 12 s after the instruction. Each regulation condition is represented on the abscissa. A main effect of condition indicates that increasing negative affect (black bar) produces larger signal change across the left and right amygdalae (n = 16 because of removal of one outlier in the right amygdala for the attend condition) compared to the other two conditions (attending, gray bars; decreasing, white bars). Error bars represent a 95% confidence interval (CI), which was computed on a within-subjects basis in accordance with Loftus and Masson (1994).

