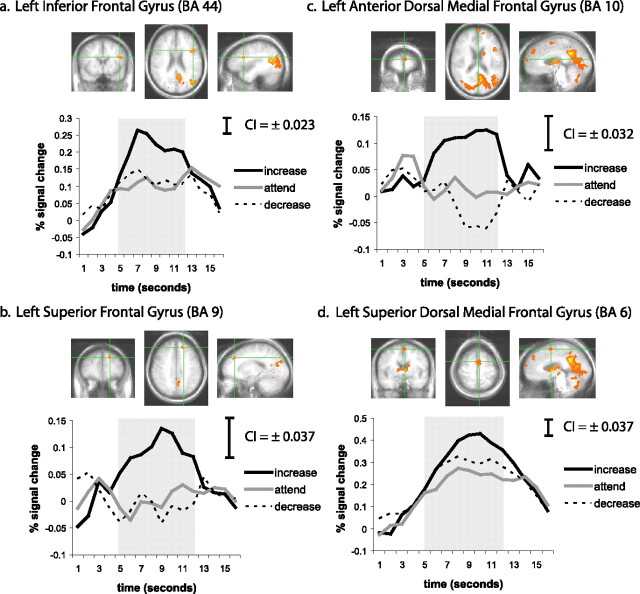
Figure 2.
a–d depict the four prefrontal cortex regions (centered under the green crosshairs) that were responsive to the regulation instructions. a, Left inferior frontal gyrus (BA 44). b, Left superior frontal gyrus (BA 9). c, Left anterior dorsal medial frontal gyrus (BA 10). d, Left superior dorsal medial frontal gyrus (BA 6). For each region, there are three cardinal views of the statistically defined cluster of interest (coronal, axial, and sagittal) as well as the estimated impulse response function for the increase (black line), attend (gray line), and decrease (dotted line) instructions in response to negative pictures. Responses were quantified as the AUC of percentage signal change estimates from 5 to 12 s after the instruction, a period indicated by the gray shading in each graph. Confidence intervals (CI; 95%), computed on a within-subjects basis in accordance with Loftus and Masson (1994) and scaled to represent each time point, are depicted at the top right of each line graph. The Talairach coordinates of the maximum F statistic for each region are presented in Table 1.

