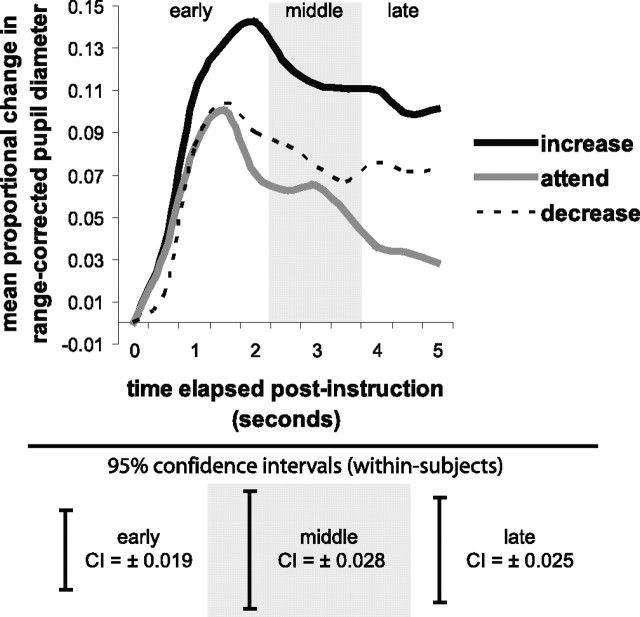
Figure 4.
Depicted here is proportional change in pupil diameter, reported separately for the increase (black line), attend (gray line), and decrease (dotted line) instructions in response to negative pictures. The shaded panel delineates the middle regulation period (2.5–3.5 s), with early (0.5–2 s) and late (4–5 s) periods appearing as unshaded before and after, respectively. Confidence intervals (CI; 95%), computed separately for the early, middle, and late regulation periods on a within-subjects basis in accordance with Loftus and Masson (1994), are depicted beneath the line graph.

