
Figure 3.
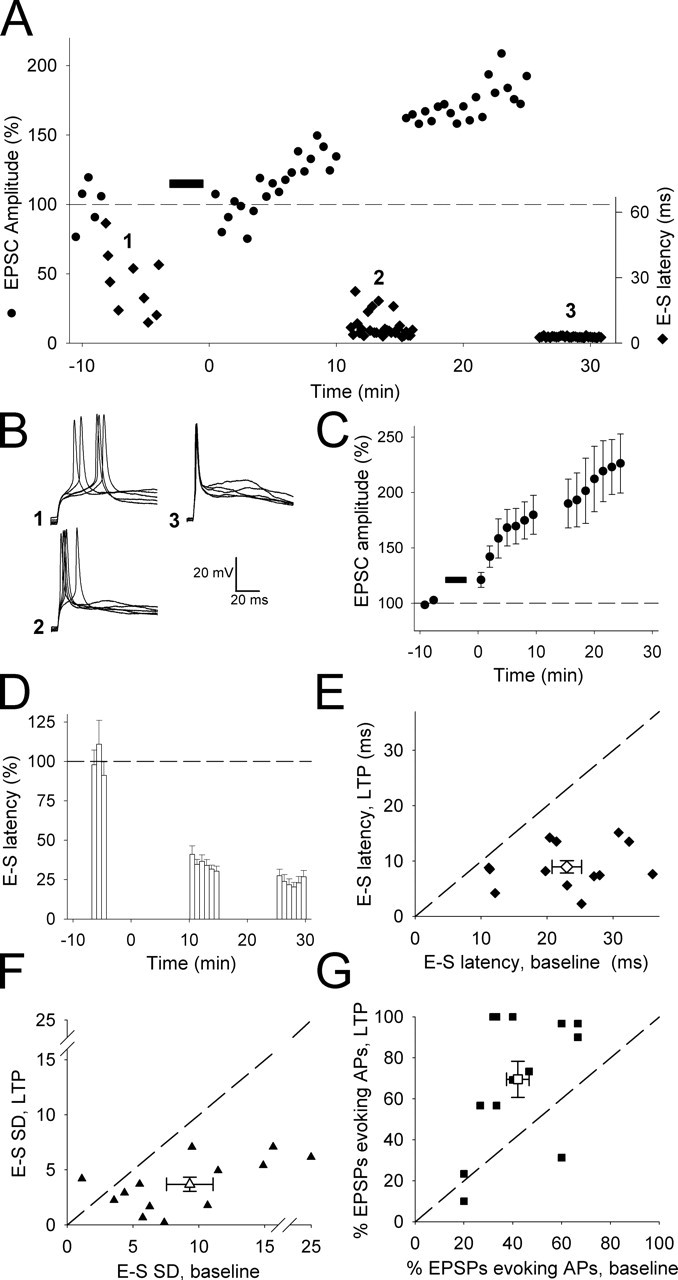
LTP at thalamocortical inputs onto neonatal layer IV neurons reduces the latency and increases the timing precision of synaptically evoked action potentials. A, EPSC amplitude (circles) and E-S latency (diamonds) versus time from an example LTP experiment. B, Representative superimposed current-clamp traces taken at the times indicated in A. C, Pooled data showing normalized EPSC versus time for all LTP experiments (n = 13). D, Pooled data showing normalized E-S latency versus time from these experiments. E, E-S latency during baseline plotted versus E-S latency after LTP induction in individual cells (filled diamonds) and for pooled data (open diamond). F, The E-S SD for baseline plotted versus E-S SD after LTP induction in individual cells (filled triangles) and for the pooled data (open triangle). G, Percentage of EPSPs evoking an action potential (AP) baseline plotted versus LTP in individual cells (filled squares) and for pooled data (open square). The dashed line is the line of unity.