
Figure 5.
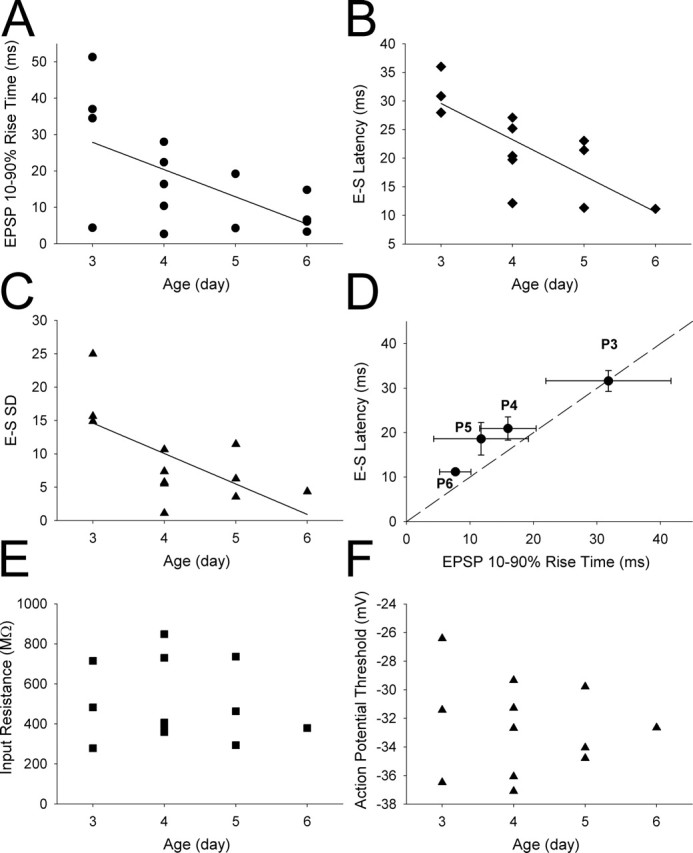
EPSP kinetics and timing of synaptically evoked action potentials in the layer IV neonatal barrel cortex are developmentally regulated. A, EPSP 10–90% rise time plotted versus age of animal from which the slices were made; the line is a linear regression through points (r2 = 0.81; p < 0.05). B, E-S latency plotted versus age; the line is a linear regression through points (r2 = 0.98; p < 0.0001). C, E-S SD plotted versus age; the line is a linear regression through points (r2 = 0.89; p < 0.01). D, Mean E-S latency plotted versus mean EPSP rise time at different postnatal ages; the dashed line is the line of unity. E, Input resistance plotted versus age; there was no significant correlation. F, Action potential threshold plotted versus age; there was no significant correlation.