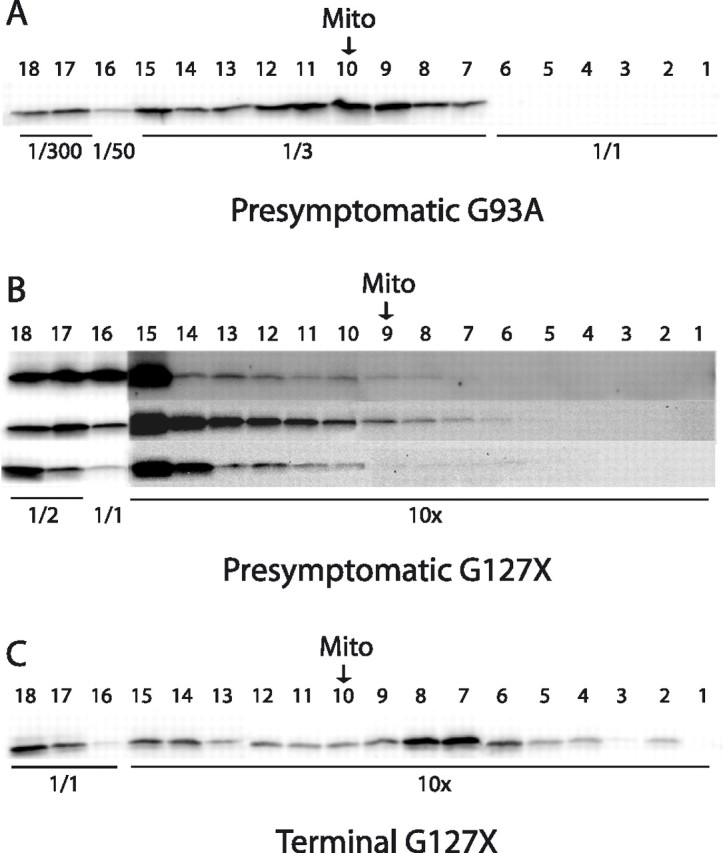
Figure 2.

Examples of Western immunoblots for localization of hSOD1 in tapped gradient fractions. To allow visualization in the same blot, the fractions were diluted or concentrated as indicated. The arrows indicate the location of the peak of the mitochondrial marker SDH (Mito). A, Density gradient centrifugation of a spinal cord extract from a presymptomatic G93A mouse; see also Figure 1D. Density gradient centrifugations of spinal cords from three different presymptomatic (B) and one terminally ill (C) G127X mice; see also Figure 1, J and K. The blots of the 10-fold concentrated fractions from the presymptomatic mice were overexposed to visualize the very faint bands.
