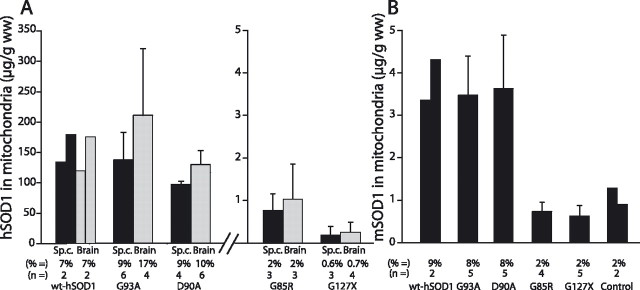
Figure 3.
Quantification of amounts and proportions of SOD1 associated with mitochondria in spinal cord (black columns) and brain (gray columns). The amount of hSOD1 in the three fractions in the gradient with the highest levels of the mitochondrial marker SDH (mostly fractions 9–11) was determined. The ratio of hSOD1/SDH in these was then multiplied by the SDH activities in all 18 fractions to estimate the total amount of hSOD1 associated with mitochondria. Both absolute and relative (percentage) amounts of hSOD1 associated with mitochondria per gram wet weight of tissue are presented. A, Amounts of hSOD1 associated with mitochondria in the different transgenic mouse strains. B, Corresponding results for mSOD1 in the transgenic strains and in nontransgenic control C57BL/6 mice. The error bars represent SDs. wt, Wild type; Sp.c., spinal cord.

